. 2012 Feb 3;10(2):157-70.
doi: 10.1016/j.stem.2011.12.017.

Polycomb associates genome-wide with a specific RNA polymerase II variant, and regulates metabolic genes in ESCs

Affiliations

Polycomb associates genome-wide with a specific RNA polymerase II variant, and regulates metabolic genes in ESCs

Emily Brookes et al. Cell Stem Cell. .

Abstract

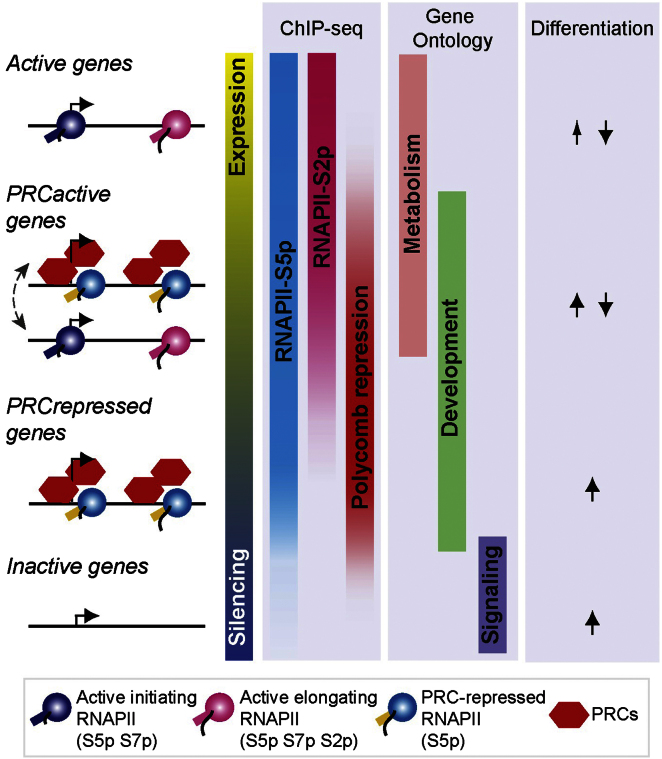
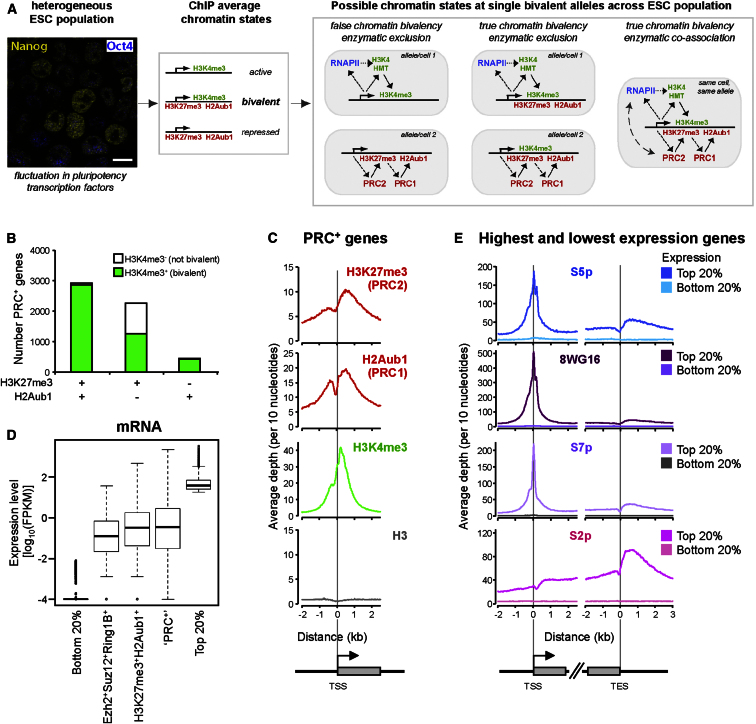
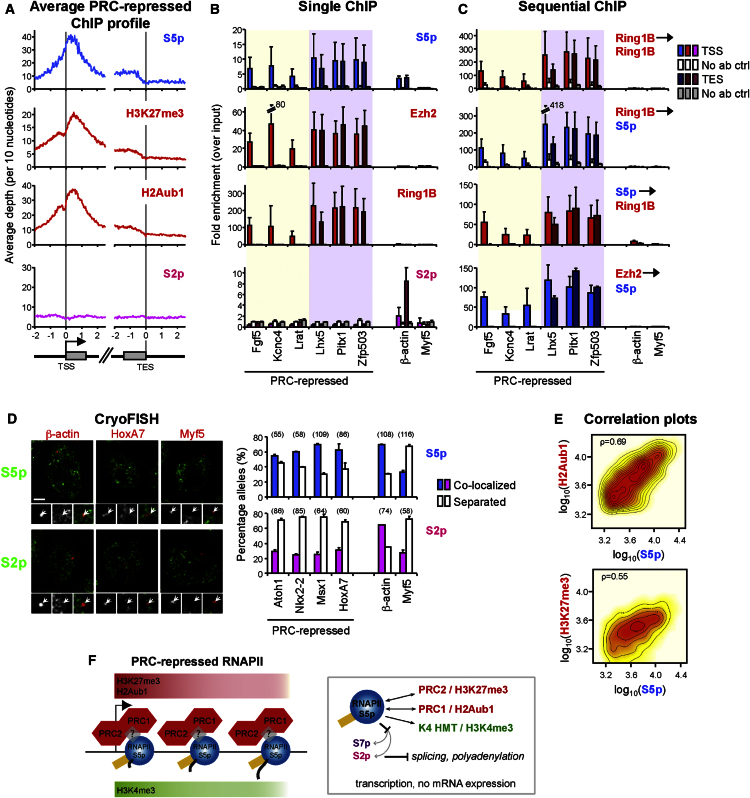
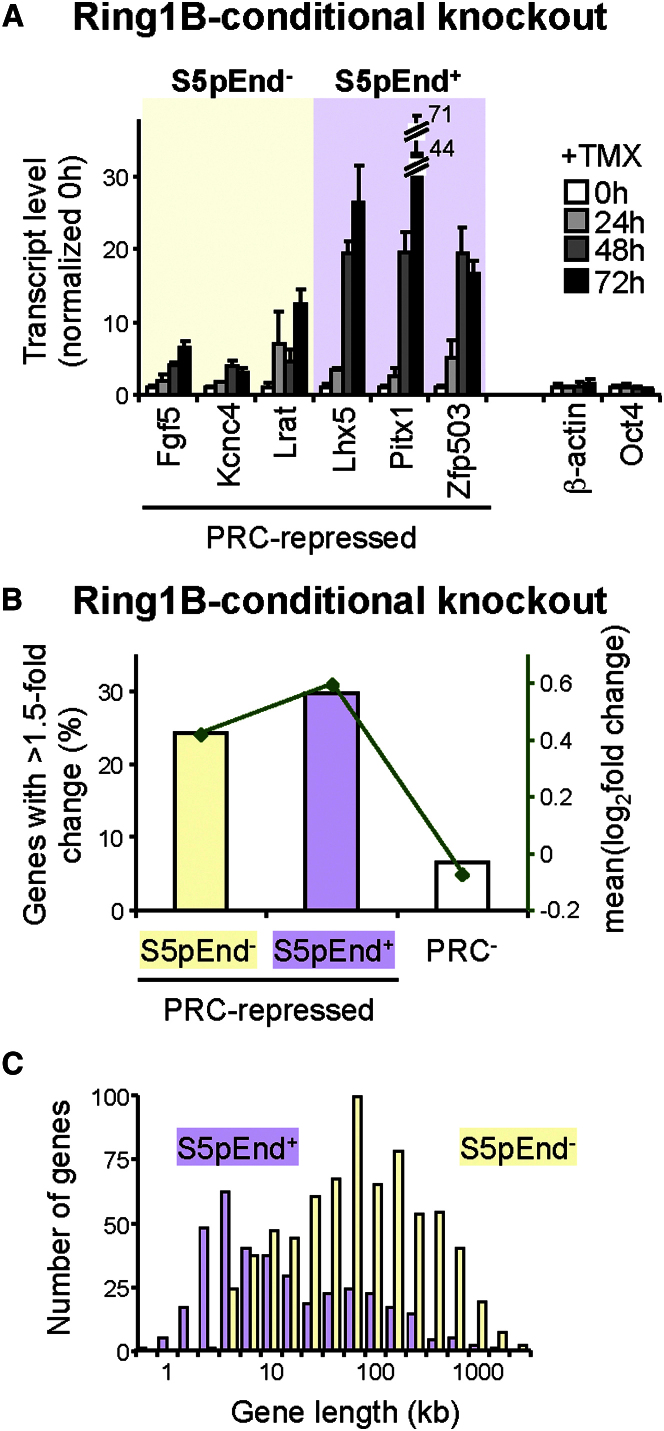
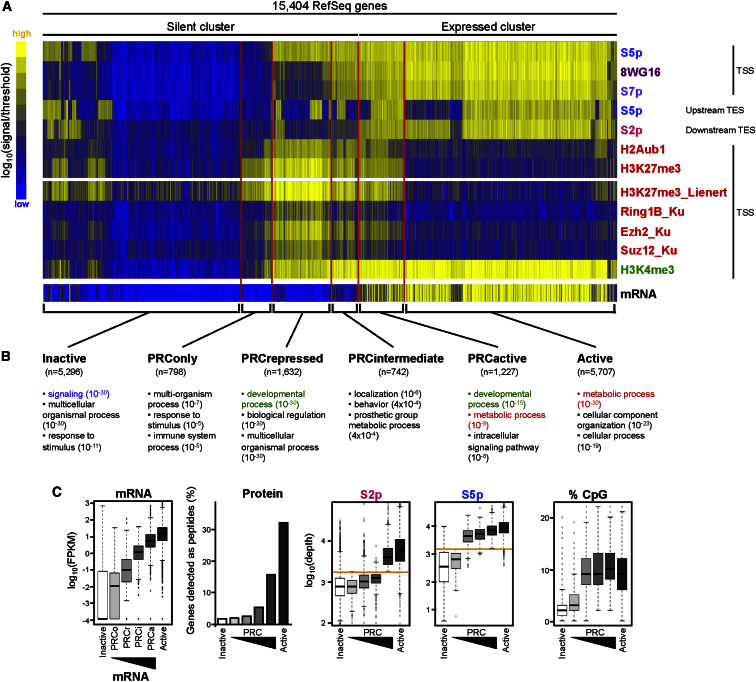
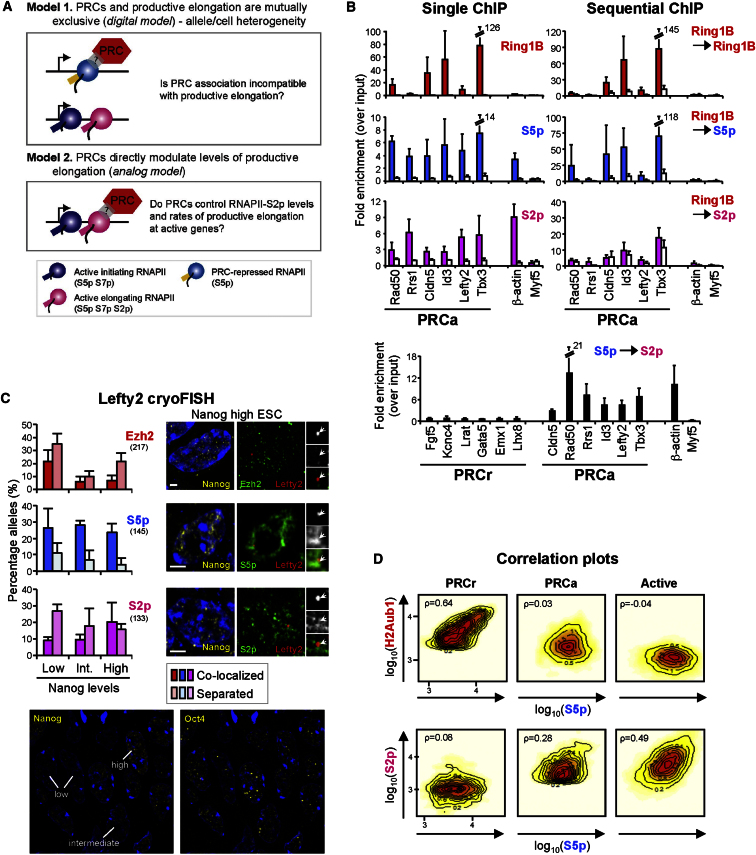
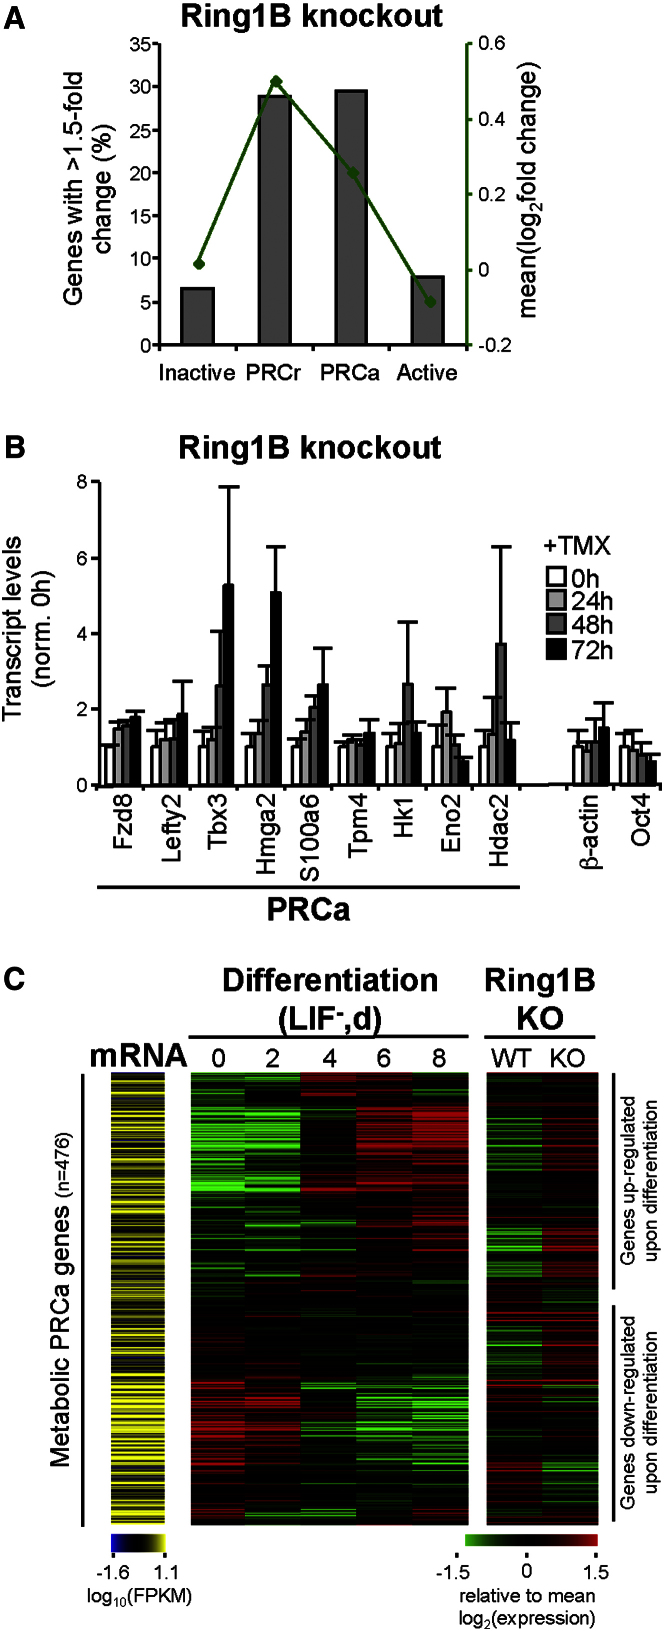
Polycomb repressor complexes (PRCs) are important chromatin modifiers fundamentally implicated in pluripotency and cancer. Polycomb silencing in embryonic stem cells (ESCs) can be accompanied by active chromatin and primed RNA polymerase II (RNAPII), but the relationship between PRCs and RNAPII remains unclear genome-wide. We mapped PRC repression markers and four RNAPII states in ESCs using ChIP-seq, and found that PRC targets exhibit a range of RNAPII variants. First, developmental PRC targets are bound by unproductive RNAPII (S5p(+)S7p(-)S2p(-)) genome-wide. Sequential ChIP, Ring1B depletion, and genome-wide correlations show that PRCs and RNAPII-S5p physically bind to the same chromatin and functionally synergize. Second, we identify a cohort of genes marked by PRC and elongating RNAPII (S5p(+)S7p(+)S2p(+)); they produce mRNA and protein, and their expression increases upon PRC1 knockdown. We show that this group of PRC targets switches between active and PRC-repressed states within the ESC population, and that many have roles in metabolism.


Figures

None
Graphical abstract
Figure 1
Figure 1
Mapping PRCs and RNAPII to Investigate Chromatin Bivalency in ESCs (A) ESCs are naturally heterogeneous for expression of some transcription factors, including Nanog and Oct4 (yellow and blue, respectively; left panel, whole-cell immunofluorescence; bar: 10 μm). Detection of H3K4me3 and H3K27me3/H2Aub1 at the same chromatin using population-based ChIP (central panel) may reflect true colocalization of the modifications, or may be due to dynamically or spatially separated marks arising from ESC interconversion (right panel). Furthermore, chromatin bivalency may occur with or without physical association of responsible enzymatic activities, due to greater longevity of histone modifications. Dotted arrow, recruitment; solid arrow, enzymatic modification. (B) Genes associated with both H3K27me3 and H2Aub1, or with H2Aub1 alone, are predominantly occupied by H3K4me3 (98% and 96%, respectively). Only 56% of H3K27me3-only genes are bound by H3K4me3. (C) Average ChIP-seq profiles of histone modifications at PRC+ genes (H3K27me3+ and/or H2Aub1+). (D) mRNA-seq expression levels for the 20% most highly and 20% least expressed genes, and for PRC-target genes marked by Ezh2, Suz12, and Ring1B, by both H3K27me3 and H2Aub1, and by H3K27me3 and/or H2Aub1 (PRC+). PRC targets show a wide range of expression levels. (E) Average ChIP-seq profiles of RNAPII for the 20% of genes with highest (bright colors) and lowest (pale colors) expression levels. See also Figures S1 and S2.
Figure 2
Figure 2
RNAPII-S5p Coassociates with PRC1 and PRC2 through Coding Regions of PRC-Repressed Genes (A) Average ChIP-seq profiles at PRC-repressed genes (H3K27me3+H2Aub1+) associated with RNAPII-S5p+S2p8WG16. S5p, H3K27me3, and H2Aub1 have similar broad profiles at TSSs and through coding regions. (B) Occupancy of RNAPII-S5p, Ezh2, Ring1B, and S2p was confirmed by ChIP-qPCR at TSSs (light) and TESs (dark) of Active (β-actin), Inactive (Myf5), and PRC-repressed genes with or without detectable TES S5p enrichment. Background levels (mean enrichment from control antibodies and beads alone) at TSSs (white bars) and TESs (gray bars) are shown. Mean and standard deviations (SD) from three to four biological replicates are shown. (C) Sequential ChIP shows RNAPII-S5p coassociation with Ring1B and Ezh2 at PRC-repressed genes. Background levels (white or gray bars) represent mean enrichment after first ChIP with Ring1B followed by re-ChIP with no antibody. No DNA was recovered from S5p→mock or Ezh2→mock (control bars are not shown for S5p→Ring1B or Ezh2→S5p). Mean and SD from four to six biological replicates are shown. (D) PRC-repressed genes associate with S5p at a similar frequency to that of active gene β-actin, but not with S2p. Localization by immuno-cryoFISH of PRC-repressed or control loci (red, arrows) relative to S5p and S2p sites (green) in ESCs was scored as “colocalized” (>1 pixel overlap) or “separate.” Bar: 2 μm. Number of loci analyzed are shown in brackets. (E) Positive correlation between S5p and H2Aub1 or H3K27me3 levels in 2kb TSS windows of PRC-repressed genes (Spearman's rank correlation coefficient; ρ) are shown. (F) PRC-repressed genes are associated simultaneously with nonproductive RNAPII-S5p binding, and the PRC activities that catalyze H3K27me3 and H2Aub1. Absence of S7p and S2p at the PRC-repressed RNAPII variant may prevent cotranscriptional recruitment of RNA processing factors, leading to RNA degradation. See also Figure S3.
Figure 3
Figure 3
Functional PRC Repression Is Proportional to RNAPII-S5p Extension (A) PRC targets become derepressed upon Ring1B removal, with a more marked effect at genes where S5p extends up to the TES (S5pEnd+), than that which occurs at genes classified as S5pEnd. RNA levels were measured in ES-ERT2 Ring1A-knockout cells after tamoxifen (TMX)-induced Ring1B knockout. Transcript levels were normalized to housekeeping genes, and to 0 hr. Mean and SD from three biological replicates are shown. (B) Analyses of microarray data for ES-ERT2 cells ± 48 hr TMX treatment (Endoh et al., 2008) shows that the percentage of PRC-repressed genes derepressed by >1.5-fold (bars) is significant irrespective of S5p detection at the TES (p < 10−16, one-tailed Fisher's exact test), although the mean fold expression change (green) is higher for genes with S5p extending to TESs (S5pEnd+). (C) S5pEnd+ PRC-repressed genes have a wide range of lengths, although the majority are shorter than those with S5p only at promoters (S5pEnd; p < 2.2 × 10−16, one-tailed Wilcoxon rank-sum test).
Figure 4
Figure 4
PRC Targets Associate with Different RNAPII Modifications and Expression Levels (A) Hierarchical clustering was performed after binary classification of RNAPII and PRC modifications for 15,404 nonoverlapping RefSeq genes. Marker enrichment at TSSs or TESs is normalized to the binary classification threshold. Four major PRC groups were identified: PRConly, PRCrepressed, PRCintermediate, and PRCactive. Remaining genes were classified as Active or Inactive. Levels of mRNA and additional markers are presented for comparison (lower panel), but were not used as clustering variables. (B) “Developmental process” is the most significantly enriched Gene Ontology (GO) term for PRCr genes, while PRCa terms include “developmental process” and “metabolic process” (p values in brackets, hypergeometric test). The full GO table with intergroup comparisons is shown in Table S3. (C) mRNA-seq levels are highest for Active genes, followed by PRCa, PRCi, PRCr, PRCo, and Inactive. Analysis of ESC SILAC data (Graumann et al., 2008) shows expression at the protein level only for PRCa and Active genes. S2p levels are only above background at Active and PRCa, while S5p levels are also substantial at PRCi and PRCr. Orange line, threshold. CpG content mirrors S5p enrichment. See also Figure S4.
Figure 5
Figure 5
PRCs and Elongating RNAPII-S2p Are Mutually Exclusive at Active PRC-Target Genes (A) Two alternative models of PRC regulation at PRCa genes. (B) Ring1B, S5p, and S2p occupancy and coassociation at Active (β-actin), Inactive (Myf5), and PRCa genes were analyzed by ChIP or re-ChIP and qPCR, as described in Figure 2. Mean and SD from two to five biological replicates are shown. ChIP-qPCR confirms binding of Ring1B, S5p, and S2p to PRCa genes, but re-ChIP shows PRC1 coassociation with S5p, but not with S2p, above background levels (white bars). Re-ChIP demonstrates simultaneous presence of S2p and S5p at PRCa and Active, but not PRCr, genes. (C) Colocalization of PRCa gene Lefty2 (red, arrows) with sites containing S5p, S2p, or Ezh2 (green) was measured by immuno-cryoFISH in ESC nuclei with different levels of Nanog (yellow; classified as high, low, or intermediate). Locus association with each marker was scored as colocalized (≥1 pixel overlap) or separate. Lefty2 associates with S5p at similar frequency regardless of Nanog status, but association with S2p is highest and Ezh2 is lowest in Nanoghigh cells. Bar: 2 μm. The number of loci analyzed is indicated in brackets. Note that all cells were positive for Oct4 despite variable levels of Nanog (lower panel). (D) Correlation plots for enrichment levels in 2 kb windows for PRCr, PRCa, and Active clusters. Positive correlations are stronger between S5p and H2Aub1 within PRCr and between S5p and S2p at PRCa genes (ρ, Spearman's rank correlation coefficient). See also Figure S5.
Figure 6
Figure 6
PRC1 Functionally Represses Active Developmental Genes and Metabolic Genes in ESCs (A) Analysis of microarray data for ES-ERT2 cells ±48 hr TMX treatment (Endoh et al., 2008) shows that PRCa genes undergo derepression after Ring1B removal. Percentage of genes showing >1.5-fold increase is statistically significant for PRCa and PRCr (p < 10−53, one-tailed Fisher's exact test). Mean fold change (green) is lower for PRCa than PRCr. (B) Single-gene qRT-PCR analyses, as described in Figure 3, show functional derepression of PRCa genes upon Ring1B removal in ES-ERT2 cells. Mean and SD from three biological replicates are shown. (C) Analyses of microarray expression data for ESC differentiation after LIF withdrawal (Shen et al., 2009) and Ring1B knockout in ES-ERT2 cells (Endoh et al., 2008) show that metabolic PRCa genes can become upregulated or downregulated upon differentiation. 476 PRCa genes with “metabolic process” GO are represented (GO:0008152). Red/green colors represent expression changes relative to the mean across the gene group represented. PRCa genes are expressed in ESCs (differentiation d0), as illustrated by mRNA-seq data (expression normalized for total RefSeq genes). Genes are ordered according to hierarchical clustering of microarray data for differentiation. See also Figure S6.

References

    1. Akhtar M.S., Heidemann M., Tietjen J.R., Zhang D.W., Chapman R.D., Eick D., Ansari A.Z. TFIIH kinase places bivalent marks on the carboxy-terminal domain of RNA polymerase II. Mol. Cell. 2009;34:387–393. - PMC - PubMed
    1. Alder O., Lavial F., Helness A., Brookes E., Pinho S., Chandrashekran A., Arnaud P., Pombo A., O'Neill L., Azuara V. Ring1B and Suv39h1 delineate distinct chromatin states at bivalent genes during early mouse lineage commitment. Development. 2010;137:2483–2492. - PMC - PubMed
    1. Alexa A., Rahnenführer J., Lengauer T. Improved scoring of functional groups from gene expression data by decorrelating GO graph structure. Bioinformatics. 2006;22:1600–1607. - PubMed
    1. Azuara V., Perry P., Sauer S., Spivakov M., Jørgensen H.F., John R.M., Gouti M., Casanova M., Warnes G., Merkenschlager M., Fisher A.G. Chromatin signatures of pluripotent cell lines. Nat. Cell Biol. 2006;8:532–538. - PubMed
    1. Bernstein B.E., Mikkelsen T.S., Xie X., Kamal M., Huebert D.J., Cuff J., Fry B., Meissner A., Wernig M., Plath K. A bivalent chromatin structure marks key developmental genes in embryonic stem cells. Cell. 2006;125:315–326. - PubMed

Publication types

MeSH terms

Associated data