. 2012 Mar 6;22(5):397-402.
doi: 10.1016/j.cub.2012.01.022. Epub 2012 Feb 2.

Cholinergic enhancement of visual attention and neural oscillations in the human brain

Affiliations

Cholinergic enhancement of visual attention and neural oscillations in the human brain

Markus Bauer et al. Curr Biol. .

Abstract

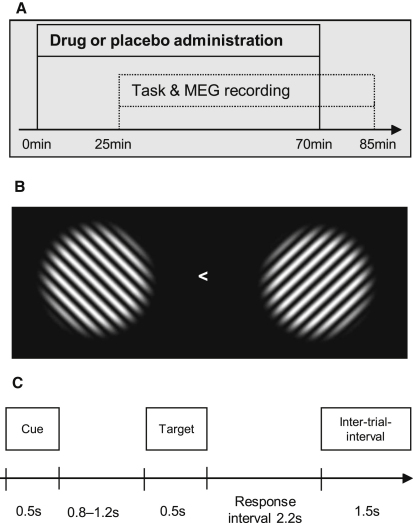
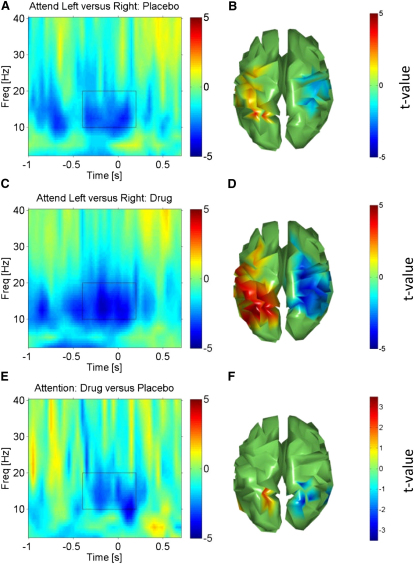
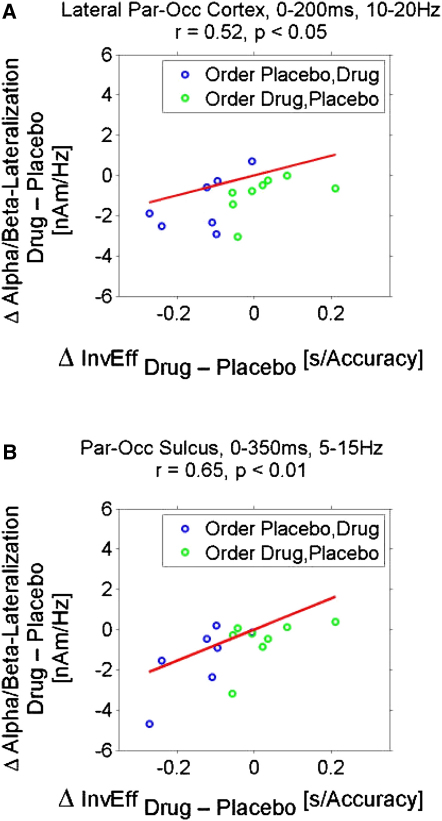
Cognitive processes such as visual perception and selective attention induce specific patterns of brain oscillations. The neurochemical bases of these spectral changes in neural activity are largely unknown, but neuromodulators are thought to regulate processing. The cholinergic system is linked to attentional function in vivo, whereas separate in vitro studies show that cholinergic agonists induce high-frequency oscillations in slice preparations. This has led to theoretical proposals that cholinergic enhancement of visual attention might operate via gamma oscillations in visual cortex, although low-frequency alpha/beta modulation may also play a key role. Here we used MEG to record cortical oscillations in the context of administration of a cholinergic agonist (physostigmine) during a spatial visual attention task in humans. This cholinergic agonist enhanced spatial attention effects on low-frequency alpha/beta oscillations in visual cortex, an effect correlating with a drug-induced speeding of performance. By contrast, the cholinergic agonist did not alter high-frequency gamma oscillations in visual cortex. Thus, our findings show that cholinergic neuromodulation enhances attentional selection via an impact on oscillatory synchrony in visual cortex, for low rather than high frequencies. We discuss this dissociation between high- and low-frequency oscillations in relation to proposals that lower-frequency oscillations are generated by feedback pathways within visual cortex.


Figures

Figure 1
Figure 1
Experimental Timeline and Stimuli (A) Physostigmine or placebo was administered intravenously starting 25 min prior to onset of the visuospatial attention task and concurrent MEG recording, then continuing until 15 min prior to end of experimental session. (B) Each trial began with onset of a symbolic cue (right or left arrow, as shown) for 500 ms, indicating which hemifeld to attend. Participants fixated the central cross throughout the remainder of the trial, which comprised a 0.8–1.2 s (rectangular distribution) cue-target interval, followed by presentation of bilateral gratings for 500 ms, with up to 2.2 s for participants to make the tilt judgement (clockwise or counterclockwise relative to diagonal) for the grating in the attended hemifield. (C) Example display of bilateral gratings, spatial frequency 1.2 cycles/degree, circular window of 7 degrees, centered at 8 degrees eccentricity along the horizontal meridian.
Figure 2
Figure 2
Spatial Attention and Alpha/Beta Oscillations (A) Time-frequency (t-f) profile for effect of spatial attention in the placebo session for symmetric hemispheric lateralization effects of Attention Left minus Attention Right at low frequency oscillations. Time zero corresponds to target onset in this and all subsequent t-f plots, and the color bar indicates t values. The t-f plot combines analogous effects in the left and right hemisphere. (B) The topography reveals suppressed/enhanced alpha/beta power (t-f window marked in A) in the hemisphere contralateral/ipsilateral to the attended hemifield, as expected (blue colors represent suppression, red enhancement). (C and D) T-f profile for corresponding effect of spatial attention in the physostigmine condition, with topography shown in (D); note the enhanced effect compared with (A) and (B). (E) T-f profile for the direct contrast of spatial attention effect in physostigmine minus placebo conditions, with topography shown in (F). (F) The cholinergic enhancement is localized to parieto-occipital cortex, an area tightly linked to alpha oscillations (see also Figure S1 for closer investigation of the parieto-occipital sulcus). Topographies are thresholded at p < 0.05, uncorrected, but for symmetric voxel pairs (see Experimental Procedures).
Figure 3
Figure 3
Spatial Attention and Gamma Oscillations (A) Time-frequency profile for symmetric hemispheric lateralization effects of Attention Left minus Attention Right for high frequency oscillations under placebo. (B and C) Topography of the high-frequency spatial attention effects under placebo for the time-frequency window marked in (A), shown in posterior view (B) or shown in ventral view (C), i.e., seen from below. Note that hot colors in the topographies indicate enhanced power contralateral to the attended hemifield, cold colors indicate reduced power ipsilateral to the attended hemifield. (D–F) Corresponding data now shown under physostigmine. Note the high reproducibility of the spatial attention effects on gamma, identical under drug/placebo. As a consequence there was no significant enhancement of gamma attention effects by the drug (the nonsignificant trend was actually for slightly stronger gamma attention effects under placebo). All values plotted are t values for the contrast of Attention Left minus Attention Right. Topographies are thresholded at p < 0.05, uncorrected, but for symmetric voxel pairs (see Experimental Procedures). See also Figure S2.
Figure 4
Figure 4
Brain-Behavior Relations Scatterplots with regression lines showing significant correlation of drug impact on poststimulus alpha/beta spatial attention effects with inverse efficiency scores for parieto-occipital cortex (see Figures 2E, 2F, and S1). (A) Correlation with the lateral parts of parieto-occipital cortex (Figure 2F, 10–20 Hz, 0–200 ms). (B) Correlation with an ROI in the parieto-occipital sulcus (Figure S1), a structure tightly linked with alpha oscillations at the t-f window where the drug effect is maximal there (5–15 Hz, 0–350 ms). Difference of attentional lateralization (Attention Left minus Attention Right) in power for right minus left hemispheres are shown on the y axis, differences of inverse efficiency is shown on the x axis. Each point gives difference scores for one participant, in blue the subjects where the drug session followed placebo and in green where drug preceded placebo. Negative values on the x and y axis indicate stronger effects in the expected direction (stronger hemispheric lateralization and faster processing for the physostigmine condition). Subjects for whom the drug was administered in the second session tend to have stronger effects. See also Figure S3.

References

    1. Womelsdorf T., Fries P. The role of neuronal synchronization in selective attention. Curr. Opin. Neurobiol. 2007;17:154–160. - PubMed
    1. Fries P., Reynolds J.H., Rorie A.E., Desimone R. Modulation of oscillatory neuronal synchronization by selective visual attention. Science. 2001;291:1560–1563. - PubMed
    1. Bauer M., Oostenveld R., Peeters M., Fries P. Tactile spatial attention enhances gamma-band activity in somatosensory cortex and reduces low-frequency activity in parieto-occipital areas. J. Neurosci. 2006;26:490–501. - PMC - PubMed
    1. Siegel M., Donner T.H., Oostenveld R., Fries P., Engel A.K. Neuronal synchronization along the dorsal visual pathway reflects the focus of spatial attention. Neuron. 2008;60:709–719. - PubMed
    1. Worden M.S., Foxe J.J., Wang N., Simpson G.V. Anticipatory biasing of visuospatial attention indexed by retinotopically specific alpha-band electroencephalography increases over occipital cortex. J. Neurosci. 2000;20:RC63. - PMC - PubMed

Publication types

LinkOut - more resources