. 2012 Apr 2;60(2):1340-51.
doi: 10.1016/j.neuroimage.2012.01.107. Epub 2012 Jan 28.

Circular representation of human cortical networks for subject and population-level connectomic visualization

Affiliations

Circular representation of human cortical networks for subject and population-level connectomic visualization

Andrei Irimia et al. Neuroimage. .

Abstract

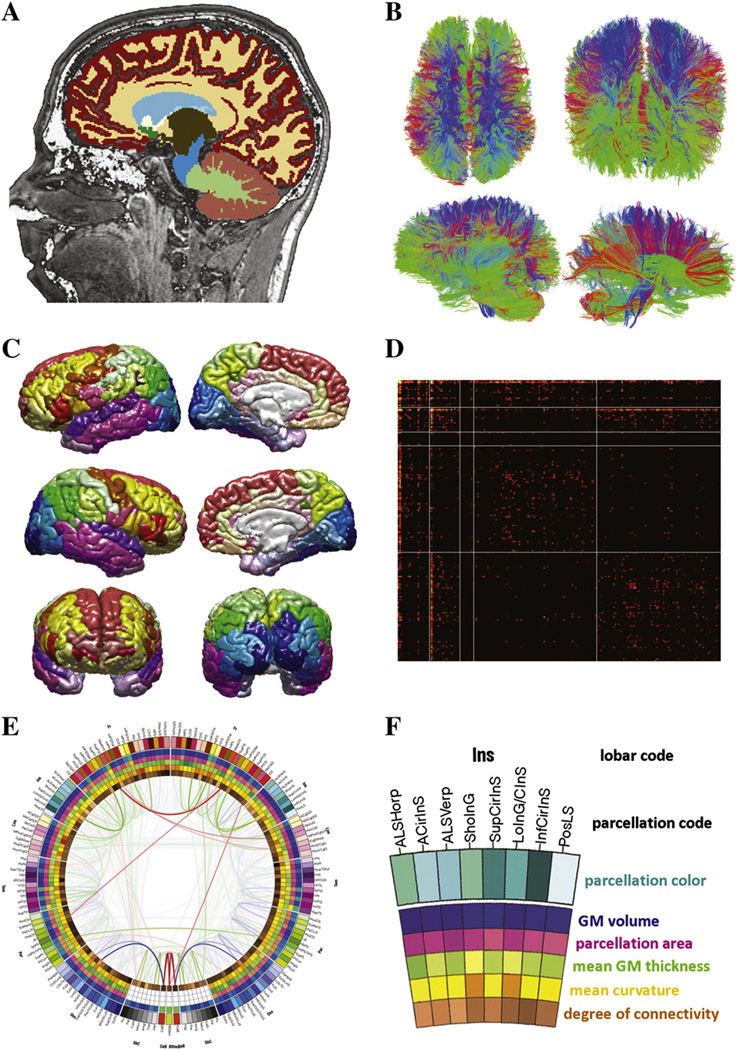
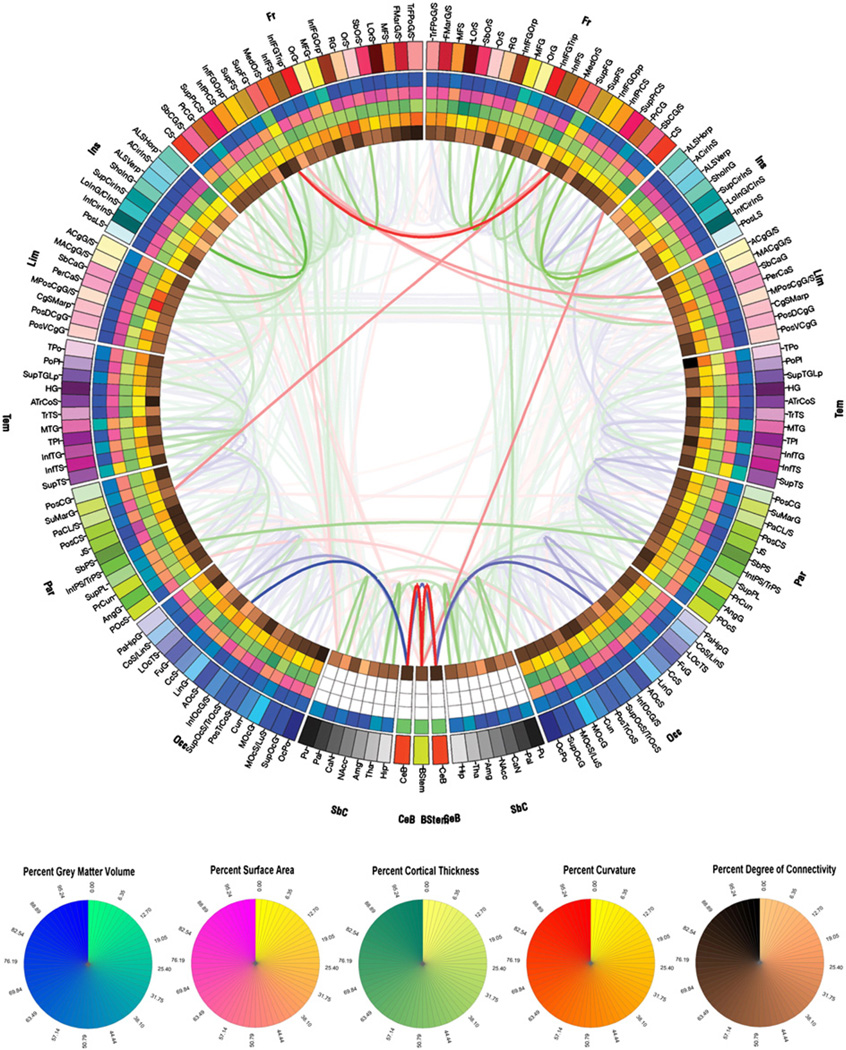
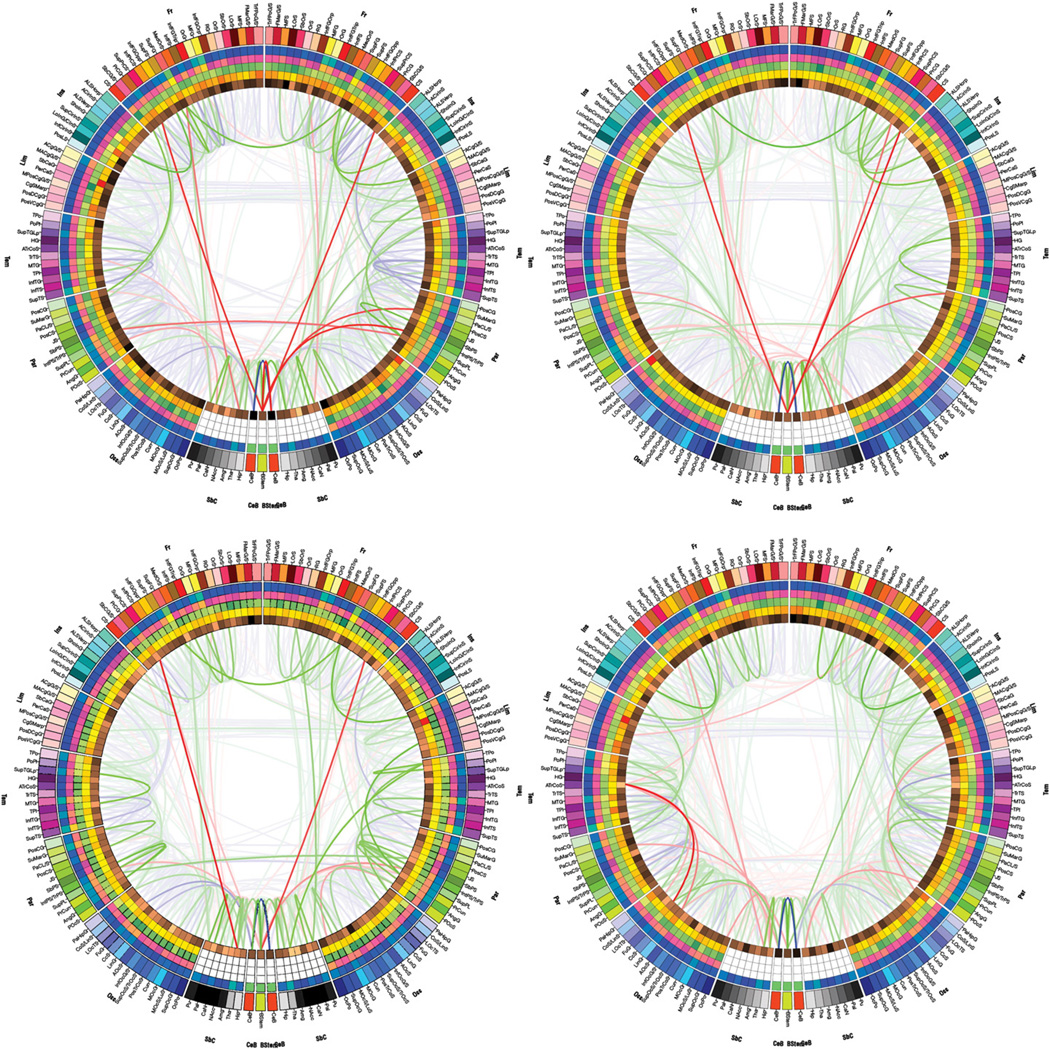
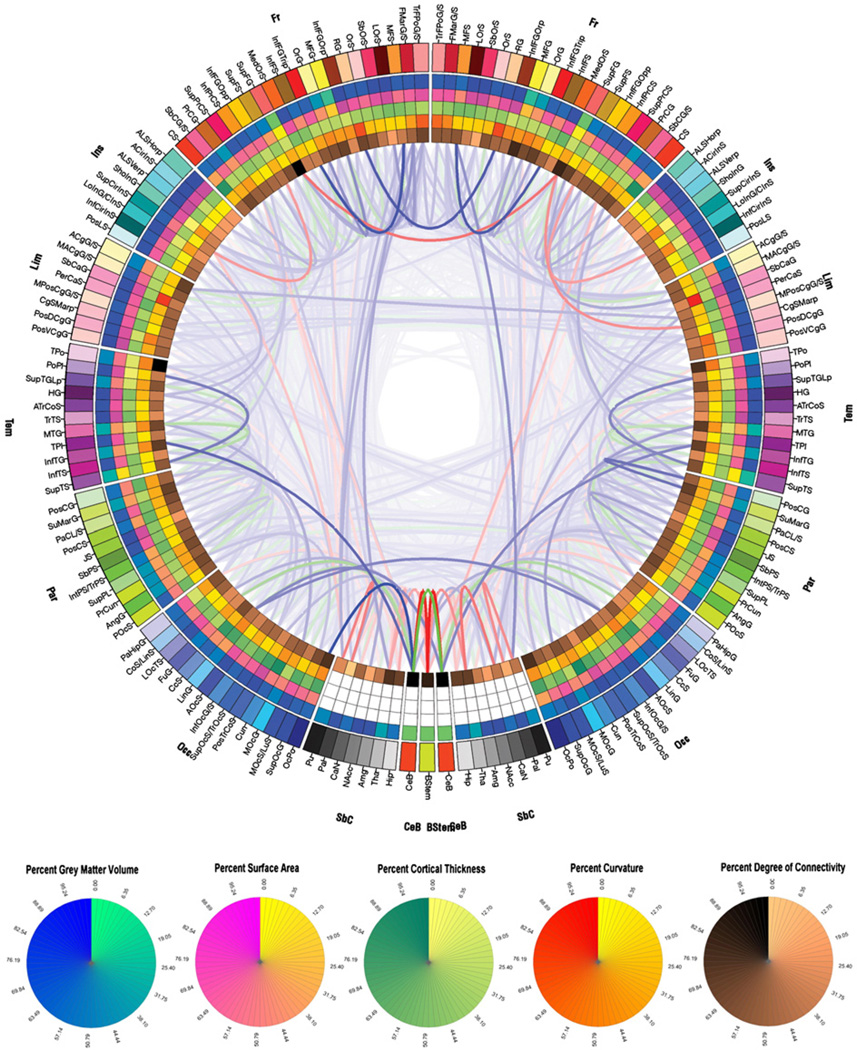
Cortical network architecture has predominantly been investigated visually using graph theory representations. In the context of human connectomics, such representations are not however always satisfactory because canonical methods for vertex-edge relationship representation do not always offer optimal insight regarding functional and structural neural connectivity. This article introduces an innovative framework for the depiction of human connectomics by employing a circular visualization method which is highly suitable to the exploration of central nervous system architecture. This type of representation, which we name a 'connectogram', has the capability of classifying neuroconnectivity relationships intuitively and elegantly. A multimodal protocol for MRI/DTI neuroimaging data acquisition is here combined with automatic image segmentation to (1) extract cortical and non-cortical anatomical structures, (2) calculate associated volumetrics and morphometrics, and (3) determine patient-specific connectivity profiles to generate subject-level and population-level connectograms. The scalability of our approach is demonstrated for a population of 50 adults. Two essential advantages of the connectogram are (1) the enormous potential for mapping and analyzing the human connectome, and (2) the unconstrained ability to expand and extend this analysis framework to the investigation of clinical populations and animal models.


Conflict of interest statement

Disclosure statement

None of the authors has a conflict of interest to disclose.

Figures

Fig. 1
Fig. 1
(A) Segmentation results from a sample subject selected from the LONI IDA and included in the present study. Segmentation and regional parcellation were performed using FreeSurfer (Dale et al., 1999; Fischl et al., 1999; Fischl et al., 2002) following the nomenclature described inDestrieux et al. (2010). (B) Results of DTI tractography analysis for a sample subject. Diffusion tensors were computed from DWI images and rotationally re-oriented at each voxel. Diffusion gradient data were processed in native space using TrackVis (trackvis.org) to reconstruct fiber tracts. (C) Representation of the reconstructed pial surface for a sample subject. Each cortical lobe was assigned a unique color scheme, as explained in the Materials and methods section. Additionally, every structure was assigned its unique RGB color based on esthetic considerations (see text for details). (D) Example of a connectivity matrix computed for a sample subject. Vertical and horizontal lines are used to delimitate entries in the matrix corresponding to connections within the left and right non-cortical regions (first two squares on the diagonal), within the left and right cortical hemispheres (last two squares on the diagonal), as well as connections between the two hemispheres or between cortex and non-cortical structures (off-diagonal elements). (E) A sample connectogram created a single subject (see Fig. 2 and text for details). (F) Legend of the representation of cortical metrics in the connectogram. Within the circular structure representing the cortical parcellations, five circular heat maps are present, each encoding one of five structural measures associated with the corresponding parcellation. Proceeding inward towards the center of the circle, these measures re: total GM volume, total area of the surface associated with the GM–WM interface (at the base of the cortical ribbon), mean cortical thickness, mean curvature and connectivity per unit volume.
Fig. 2
Fig. 2
Connectogram for a sample subject. The outermost ring shows the various brain regions arranged by lobe (fr — frontal; ins — insula; lim — limbic; tem — temporal; par — parietal; occ — occipital; nc — non-cortical; bs — brain stem; CeB — cerebellum) and further ordered anterior-to-posterior. The color map of each region is lobe-specific and maps to the color of each regional parcellation as shown in Fig. 1(C). The set of five rings (from the outside inward) reflect the measures listed in Fig. 1(F). For non-cortical regions, only average regional volume is shown. The links represent the computed degrees of connectivity between segmented brain regions. Links shaded in blue represent DTI tractography pathways in the lower third of the distribution of FA, green lines the middle third, and red lines the top third (see text for details). Circular color maps detail the scale for each metric.
Fig. 3
Fig. 3
Connectograms of four subjects selected from the healthy population. Illustrated are both the degrees of similarity and of variability between the connectivity profiles of different subjects, which can be easily explored using our connectogram methodology.
Fig. 4
Fig. 4
As in Fig. 2, for the entire population of 50 subjects.

References

    1. Bassett DS, Gazzaniga MS. Understanding complexity in the human brain. Trends Cogn. Sci. 2011;15:200–209. - PMC - PubMed
    1. Bassett DS, Brown JA, Deshpande V, Carlson JM, Grafton ST. Conserved and variable architecture of human white matter connectivity. Neuroimage. 2011;54:1262–1279. - PubMed
    1. Blondel VD, Guillaume J-L, Lambiotte R, Lefebvre E. Fast unfolding of communities in large networks. J. Stat. Mech.: Theory Exp. 2008 P10008.
    1. Brandes U. A faster algorithm for betweenness centrality. Journal of Mathematical Sociology. 2001;25:163–177.
    1. Bullmore E, Sporns O. Complex brain networks: graph theoretical analysis of structural and functional systems. Nat. Rev. Neurosci. 2009;10:186–198. - PubMed

Publication types