

Functional melanocortin-2 receptors are expressed by mouse aorta-derived mesenchymal progenitor cells
- PMID: 22306084
- PMCID: PMC3485690
- DOI: 10.1016/j.mce.2012.01.019
Functional melanocortin-2 receptors are expressed by mouse aorta-derived mesenchymal progenitor cells
Abstract
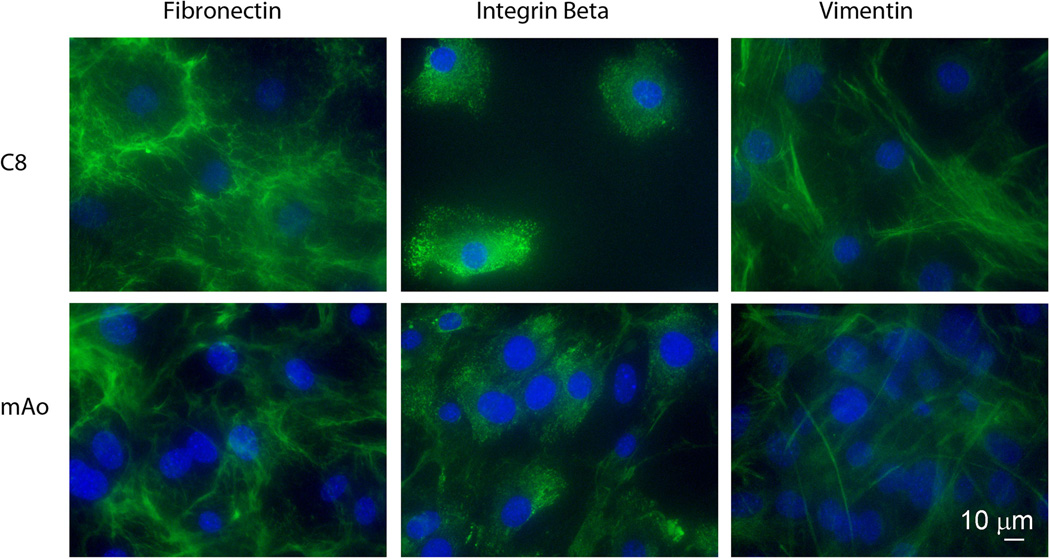
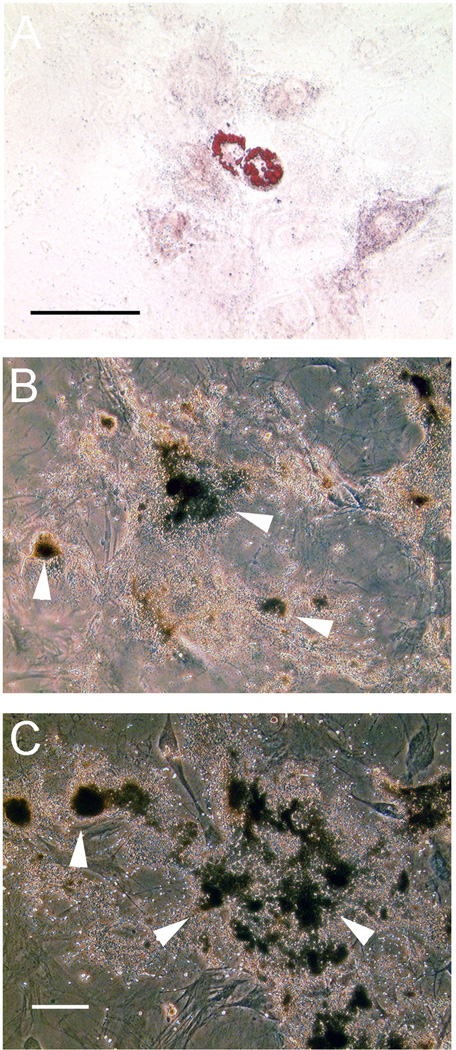
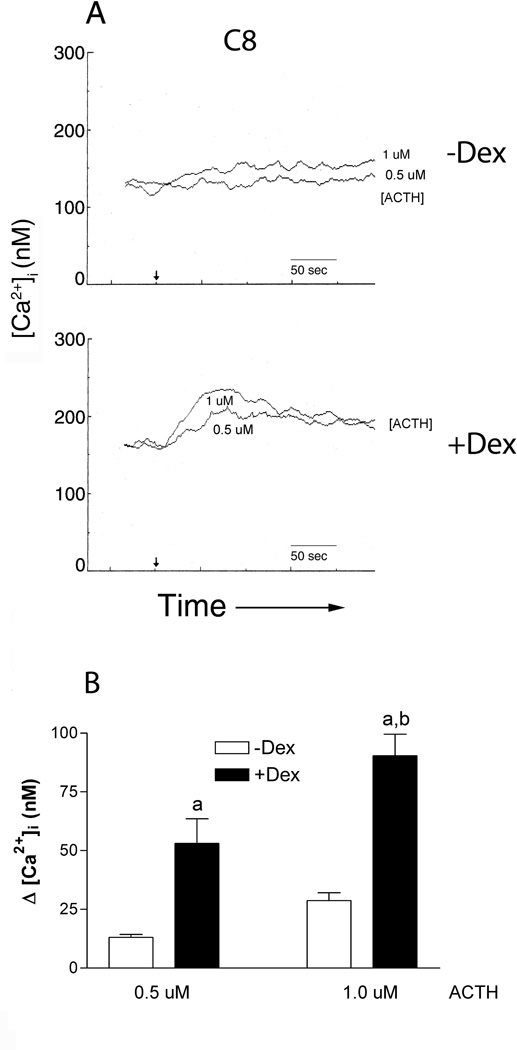
A local melanocortin system is active during tissue injury and inflammation. Thus far this system has been described as autocrine in nature where local production of pro-opiomelanocortin (POMC) peptides by leukocytes feeds back on melanocortin receptor (MC-R) expressing immune cells to quell inflammatory cytokine production. Here we present evidence that POMC peptides may generate extracellular matrix (ECM) changes by inducing matrix production by cells of the mesenchymal lineage through activation of the MC2-R. Using immunoblot, we determined that mouse aorta-derived mesenchymal progenitor cells express both MC2-R and MC3-R. These progenitors respond to treatment with ACTH by increasing collagen matrix synthesis as assessed by picrosirius red stain and (3)H-proline incorporation. ACTH also induces transient increases in intracellular calcium ([Ca(2+)](i)) as assessed using the fluorescent Ca(2+) indicator, fura-2. The ACTH-induced changes in [Ca(2+)](i) are consistent with MC2-R signaling and consist of both an intracellular release and an extracellular influx of Ca(2+). Both mouse aortic mesenchymal progenitors and mouse macrophage cells express POMC and the prohormone convertase 1/3 (PC1/3) indicating they have the potential to contribute to the local production of POMC peptides. These data demonstrate functional MC2-R expression in mouse aorta-derived mesenchymal progenitors and implicate both macrophage and mesenchymal cells as relevant sources of local POMC peptides.
Copyright © 2012 Elsevier Ireland Ltd. All rights reserved.
Conflict of interest statement
The authors have no conflicts of interest.
Figures


Similar articles
-
ACTH promotes chondrogenic nodule formation and induces transient elevations in intracellular calcium in rat bone marrow cell cultures via MC2-R signaling.Cell Tissue Res. 2013 May;352(2):413-25. doi: 10.1007/s00441-013-1561-6. Epub 2013 Jan 29. Cell Tissue Res. 2013. PMID: 23358747 Free PMC article.
-
ACTH enhances chondrogenesis in multipotential progenitor cells and matrix production in chondrocytes.Bone. 2004 Jul;35(1):96-107. doi: 10.1016/j.bone.2004.03.015. Bone. 2004. PMID: 15207745
-
The melanocortin receptor subtypes in chicken have high preference to ACTH-derived peptides.Br J Pharmacol. 2004 Nov;143(5):626-37. doi: 10.1038/sj.bjp.0705900. Epub 2004 Oct 4. Br J Pharmacol. 2004. PMID: 15466451 Free PMC article.
-
Melanocortins in human melanocytes.Cell Mol Biol (Noisy-le-grand). 2006 May 30;52(2):75-8. Cell Mol Biol (Noisy-le-grand). 2006. PMID: 16914090 Review.
-
Expression of functional melanocortin receptors and proopiomelanocortin peptides by human dermal microvascular endothelial cells.Ann N Y Acad Sci. 1999 Oct 20;885:239-53. doi: 10.1111/j.1749-6632.1999.tb08681.x. Ann N Y Acad Sci. 1999. PMID: 10816657 Review.
Cited by
-
Development of autoimmune hair loss disease alopecia areata is associated with cardiac dysfunction in C3H/HeJ mice.PLoS One. 2013 Apr 26;8(4):e62935. doi: 10.1371/journal.pone.0062935. Print 2013. PLoS One. 2013. PMID: 23658656 Free PMC article.
-
The Importance of Melanocortin Receptors and Their Agonists in Pulmonary Disease.Front Med (Lausanne). 2019 Jun 27;6:145. doi: 10.3389/fmed.2019.00145. eCollection 2019. Front Med (Lausanne). 2019. PMID: 31316990 Free PMC article. Review.
-
Mouse Mesenchymal Progenitor Cells Expressing Adipogenic and Osteogenic Transcription Factors Suppress the Macrophage Inflammatory Response.Stem Cells Int. 2017;2017:5846257. doi: 10.1155/2017/5846257. Epub 2017 Jan 16. Stem Cells Int. 2017. PMID: 28191017 Free PMC article.
-
Role of ACTH and Other Hormones in the Regulation of Aldosterone Production in Primary Aldosteronism.Front Endocrinol (Lausanne). 2016 Jun 27;7:72. doi: 10.3389/fendo.2016.00072. eCollection 2016. Front Endocrinol (Lausanne). 2016. PMID: 27445975 Free PMC article. Review.
-
Mouse aorta-derived mesenchymal progenitor cells contribute to and enhance the immune response of macrophage cells under inflammatory conditions.Stem Cell Res Ther. 2015 Apr 14;6(1):56. doi: 10.1186/s13287-015-0071-8. Stem Cell Res Ther. 2015. PMID: 25889992 Free PMC article.
References
-
- Adiguzel E, Ahmad PJ, Franco C, Bendeck MP. Collagens in the progression and complications of atherosclerosis. Vasc Med. 2009;14:73–89. - PubMed
-
- Adiguzel E, Hou G, Mulholland D, Hopfer U, Fukai N, Olsen B, Bendeck M. Migration and growth are attenuated in vascular smooth muscle cells with type VIII collagen-null alleles. Arterioscler Thromb Vasc Biol. 2006;26:56–61. - PubMed
-
- Bicknell AB. The tissue-specific processing of pro-opiomelanocortin. J Neuroendocrinol. 2008;20:692–699. - PubMed
-
- Boston BA. The role of melanocortins in adipocyte function. Ann N Y Acad Sci. 1999;885:75–84. - PubMed
Publication types
MeSH terms
Substances
Grants and funding
LinkOut - more resources
Full Text Sources
Research Materials
Miscellaneous
