. 2012 Mar;14(2):112-9.
doi: 10.1016/j.ymben.2012.01.003. Epub 2012 Jan 28.

Exploring the gap between dynamic and constraint-based models of metabolism

Affiliations

Exploring the gap between dynamic and constraint-based models of metabolism

Daniel Machado et al. Metab Eng. 2012 Mar.

Abstract

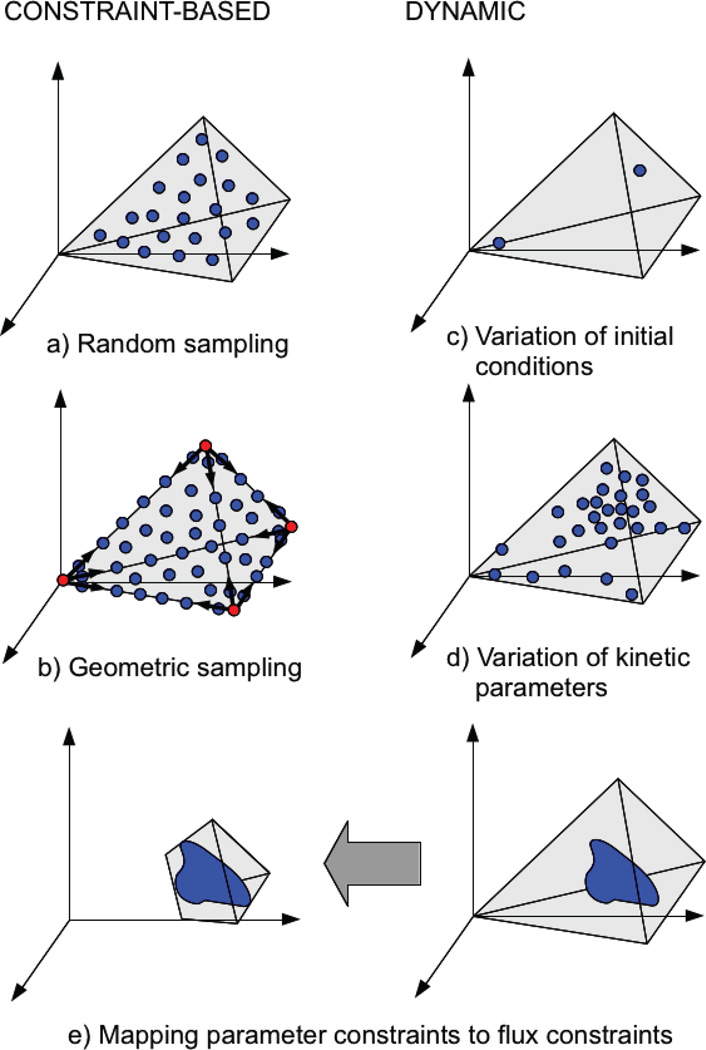
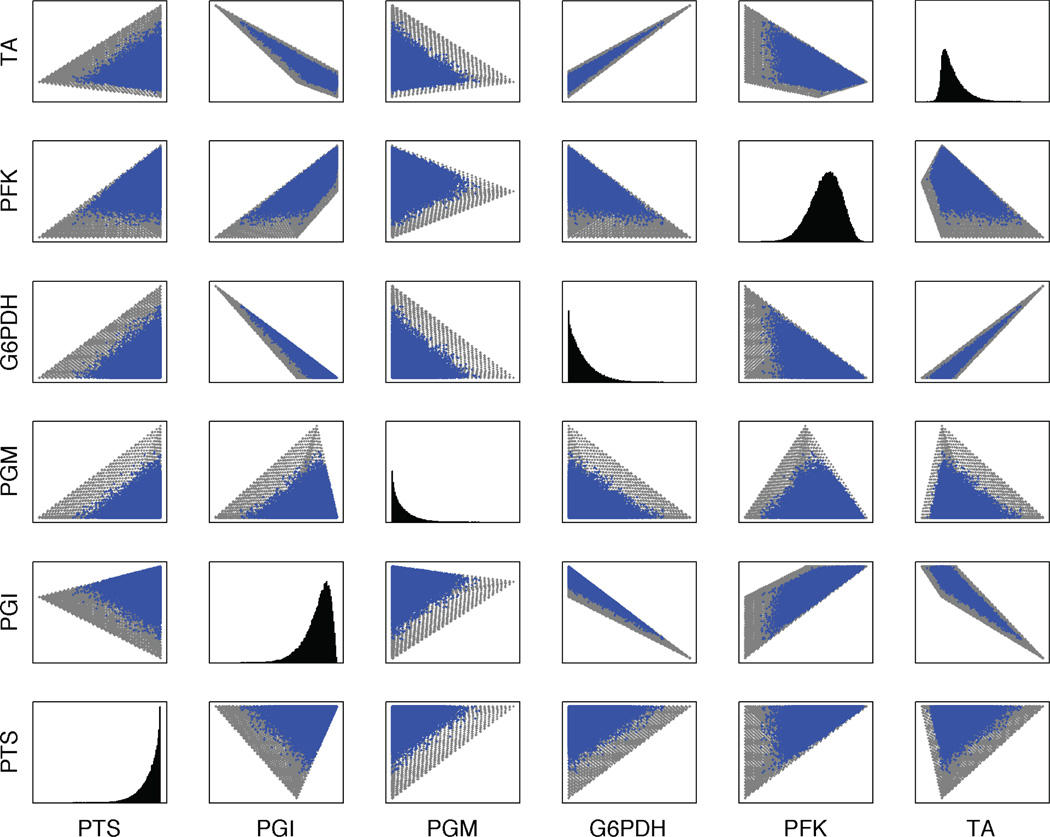
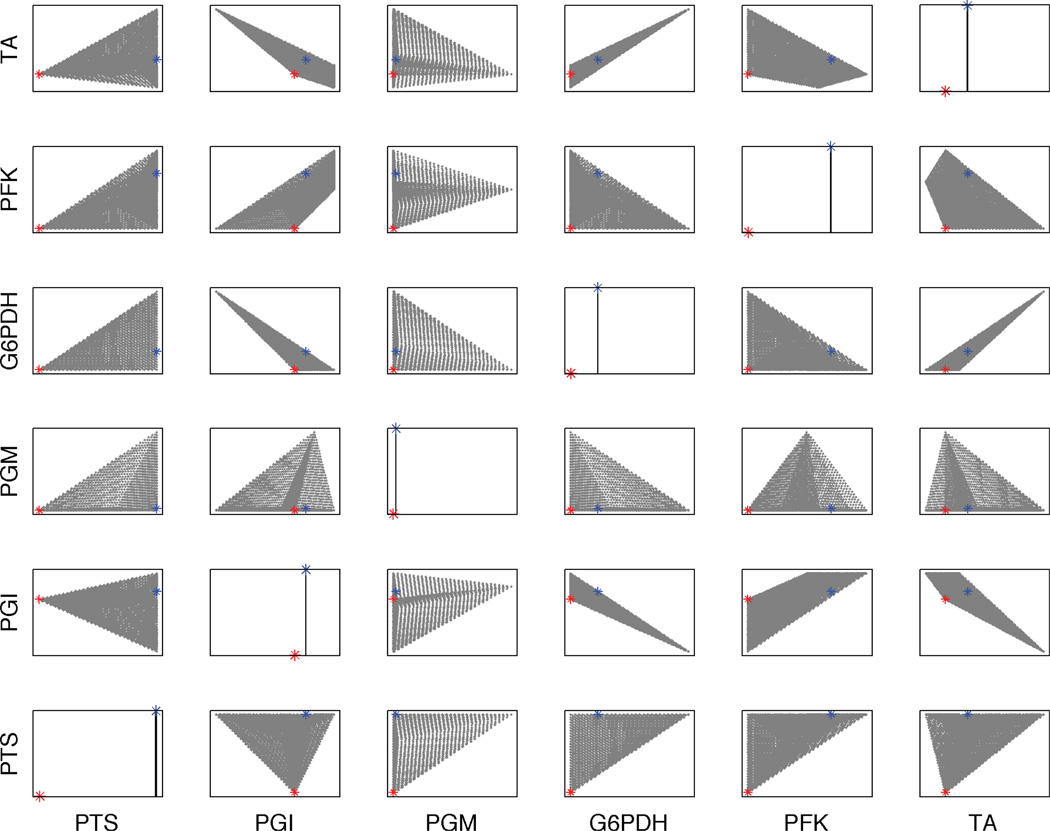
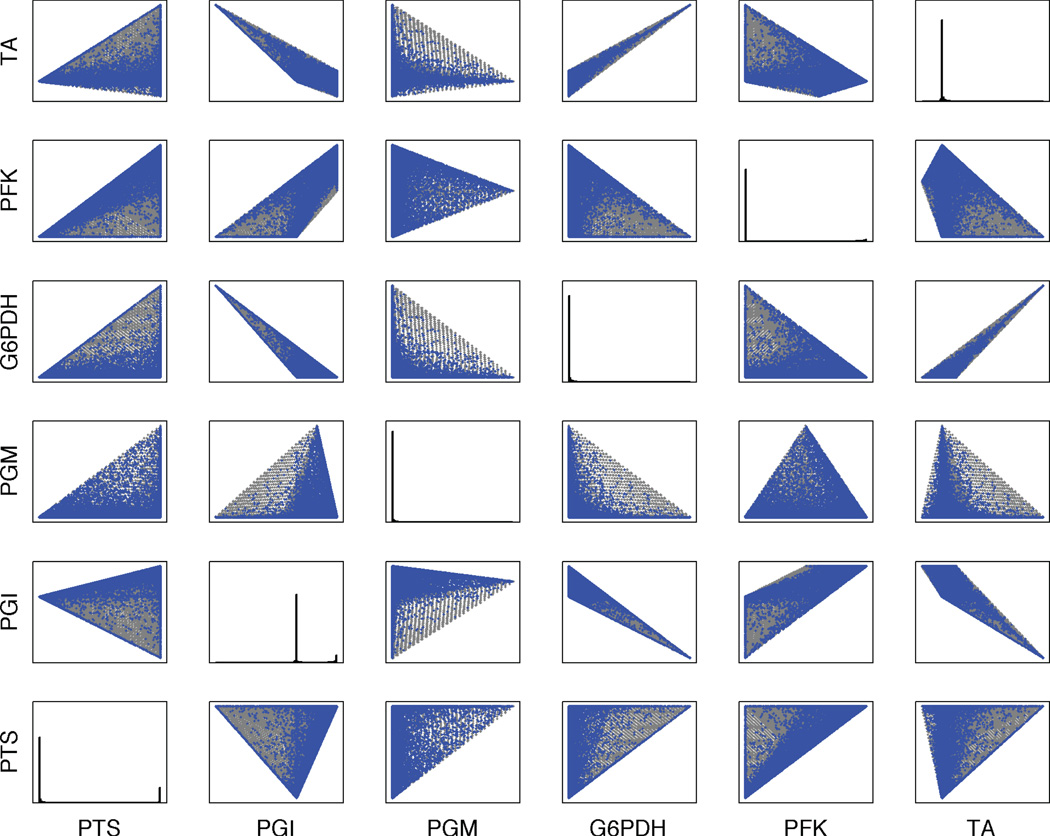
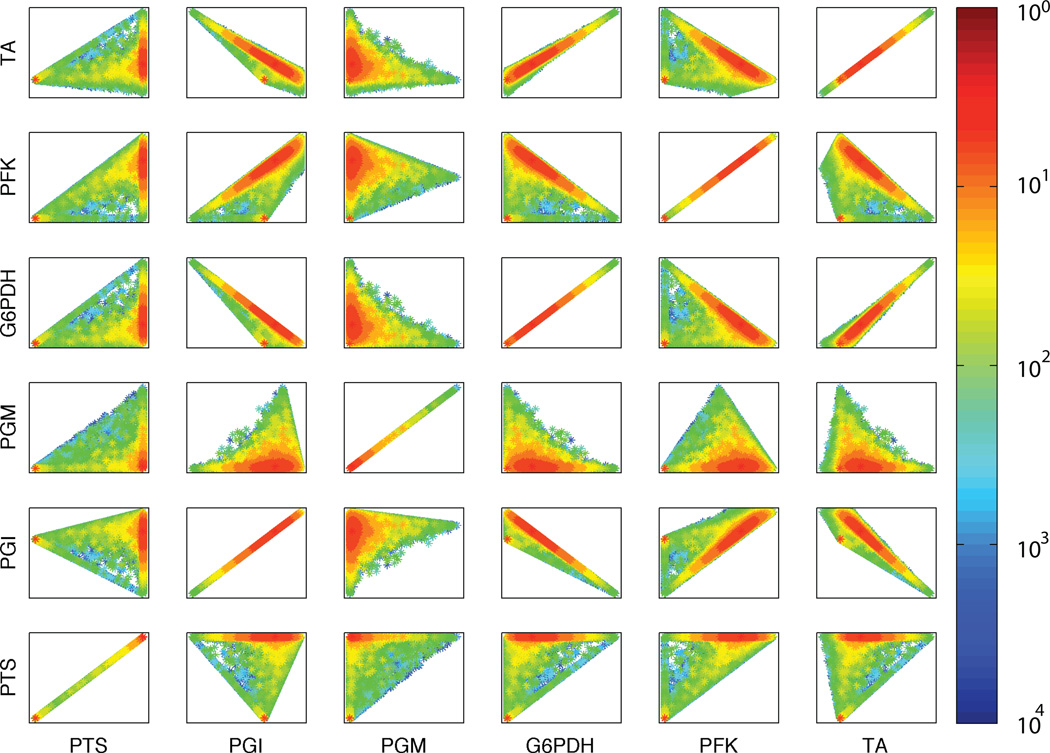
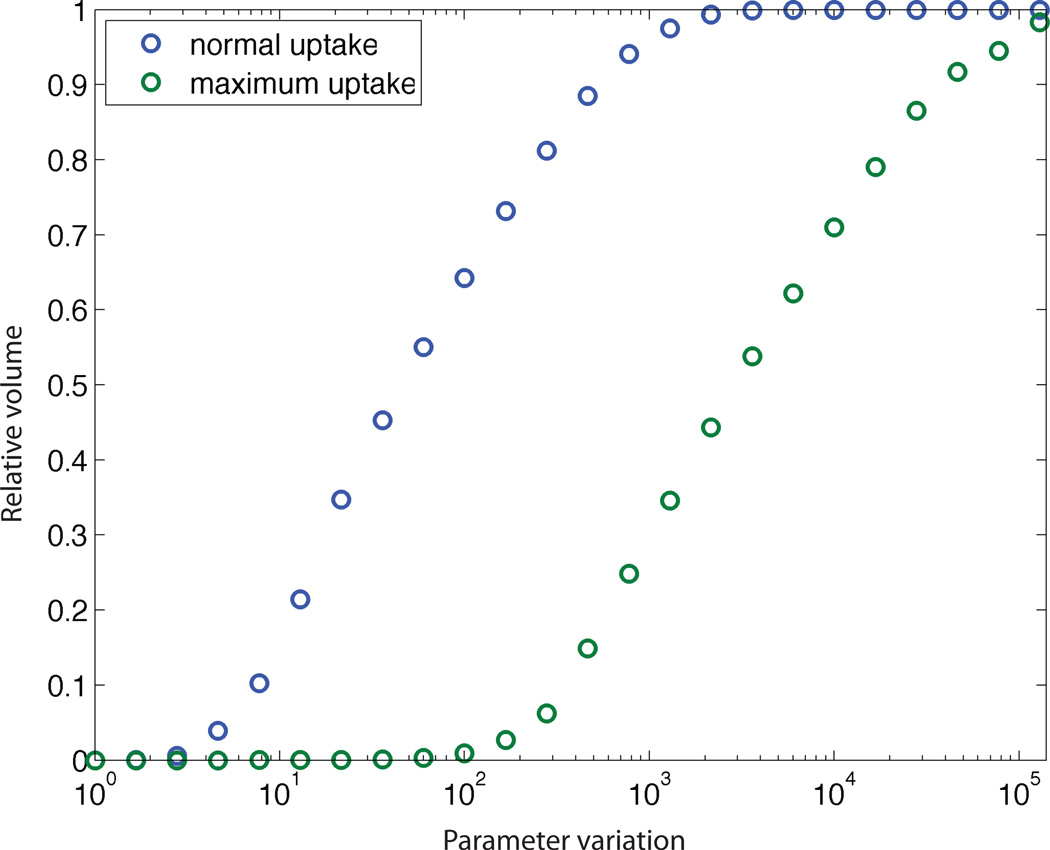
Systems biology provides new approaches for metabolic engineering through the development of models and methods for simulation and optimization of microbial metabolism. Here we explore the relationship between two modeling frameworks in common use namely, dynamic models with kinetic rate laws and constraint-based flux models. We compare and analyze dynamic and constraint-based formulations of the same model of the central carbon metabolism of Escherichia coli. Our results show that, if unconstrained, the space of steady states described by both formulations is the same. However, the imposition of parameter-range constraints can be mapped into kinetically feasible regions of the solution space for the dynamic formulation that is not readily transferable to the constraint-based formulation. Therefore, with partial kinetic parameter knowledge, dynamic models can be used to generate constraints that reduce the solution space below that identified by constraint-based models, eliminating infeasible solutions and increasing the accuracy of simulation and optimization methods.


Figures

Figure 1
Figure 1
Overview of the methods applied in this work to the constraint-based and the dynamic model. The solution space of the constraint-based model has been sampled by (a) random sampling using a Hit-and-Run algorithm and (b) geometric sampling using the corners of the flux cone as starting points. The solution space of the dynamic model has been sampled by (c) varying the initial metabolite concentrations and (d) the kinetic parameters. (e) By constraining the kinetic parameters of the dynamic model we can delimit kinetically feasible flux regions and transfer them to the constraint-based model.
Figure 2
Figure 2
Pairwise projection of the sampling of the constraint-based solution space using the hit-and-run sampler (blue) and the geometric sampler (gray). The diagonal shows the probability distribution for each reaction relative to the hit-and-run sampling. Only the first six reactions are shown. The complete data are in Supplementary material. Note that the gray points are plotted underneath the blue ones, and that the geometric sampler delineates all of the space covered by the hit-and-run sampler, plus the additional spaces seen here.
Figure 3
Figure 3
Pairwise projection of the sampling of the solution space obtained for the dynamic model by sampling the initial metabolite concentrations, overlapping the complete solution space (gray) for better visualization. The blue dot shows the location of the original steady state. The red dot shows the location of the secondary steady state. Only the first six reactions are shown. The complete data are in Supplementary material. The diagonal gives the relative probabilities of the steady-state flux distribution.
Figure 4
Figure 4
Pairwise projection of the sampling of the steady-state solution space for the dynamic model obtained by sampling the kinetic parameters (blue). The corresponding space overlaps the solution space given by the stoichiometric model (gray). The diagonal shows the probability distribution for each reaction. Only the first six reactions are shown. The complete data are in Supplementary material.
Figure 5
Figure 5
Pairwise projection, in heat-map form, of the solution space reachable by the dynamic model as a function of the variation, in terms of orders of magnitude, of the kinetic parameter space. The diagonal shows the variation for each flux independently. Only the first six reactions are shown. The complete data are in Supplementary material.
Figure 6
Figure 6
Relative volume of the kinetically feasible solution space, compared to the original space, as a function of the parameter variation, in terms of orders of magnitude. The volume was calculated for the original glucose uptake rate in the model and also for the maximum uptake rate.

References

    1. Beard D, Liang S, Qian H. Energy balance for analysis of complex metabolic networks. Biophysical Journal. 2002;83(1):79–86. - PMC - PubMed
    1. Burgard A, Pharkya P, Maranas C. OptKnock: A bilevel programming framework for identifying gene knockout strategies for microbial strain optimization. Biotechnology and Bioengineering. 2003;84(6):647–657. - PubMed
    1. Chassagnole C, Noisommit-Rizzi N, Schmid J, Mauch K, Reuss M. Dynamic modeling of the central carbon metabolism of Escherichia coli. Biotechnology and Bioengineering. 2002;79(1):53–73. - PubMed
    1. Covert M, Palsson B. Constraints-based models: Regulation of gene expression reduces the steady-state solution space. Journal of Theoretical Biology. 2003;221(3):309–325. - PubMed
    1. Edwards J, Palsson B. Metabolic flux balance analysis and the in silico analysis of Escherichia coli K-12 gene deletions. BMC Bioinformatics. 2000;1(1):1. - PMC - PubMed

Publication types

LinkOut - more resources