Comparative Study
. 2012 Mar 16;417(1-2):112-28.
doi: 10.1016/j.jmb.2012.01.011. Epub 2012 Jan 28.

The Hill model for binding myosin S1 to regulated actin is not equivalent to the McKillop-Geeves model

Affiliations
Comparative Study

The Hill model for binding myosin S1 to regulated actin is not equivalent to the McKillop-Geeves model

Srboljub M Mijailovich et al. J Mol Biol. .

Abstract

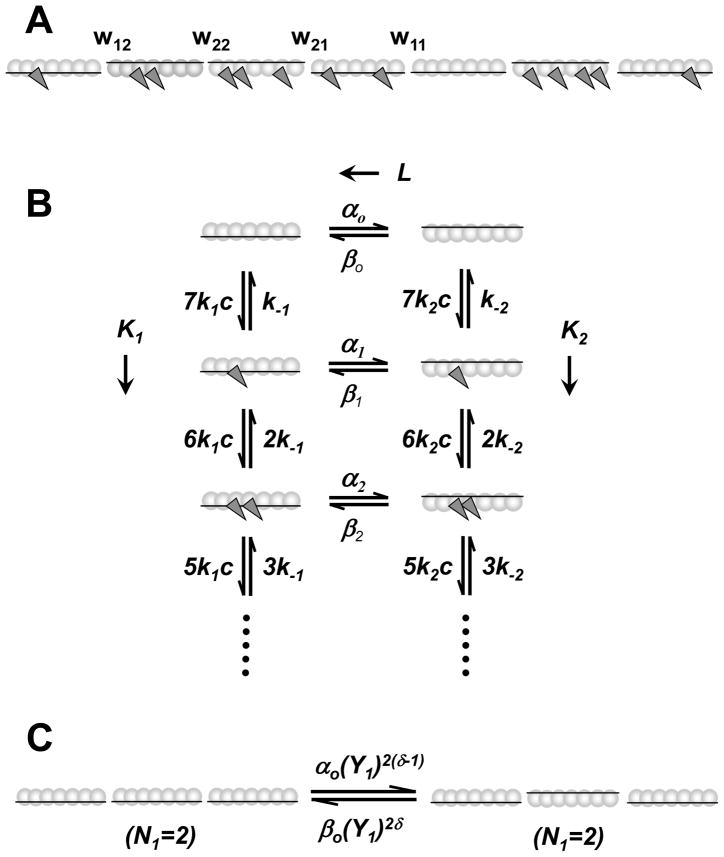
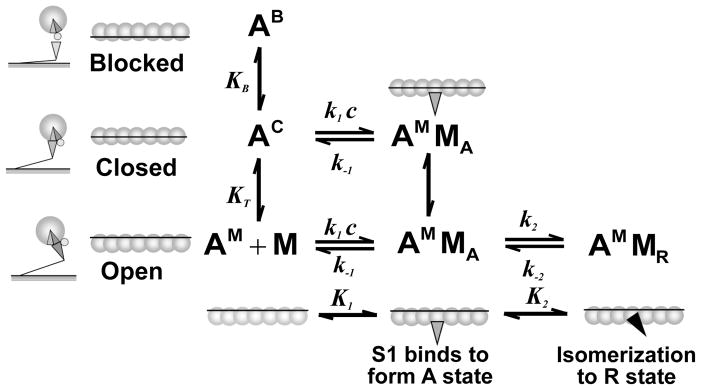
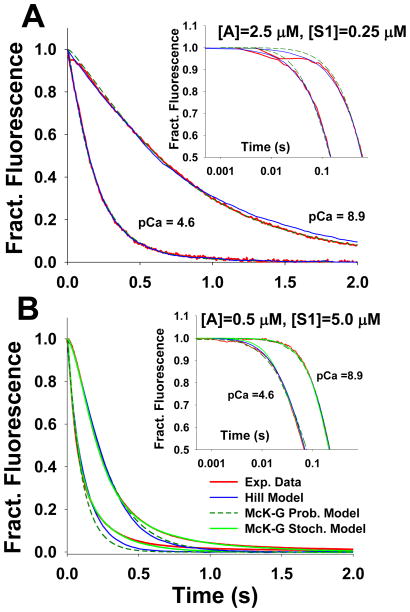
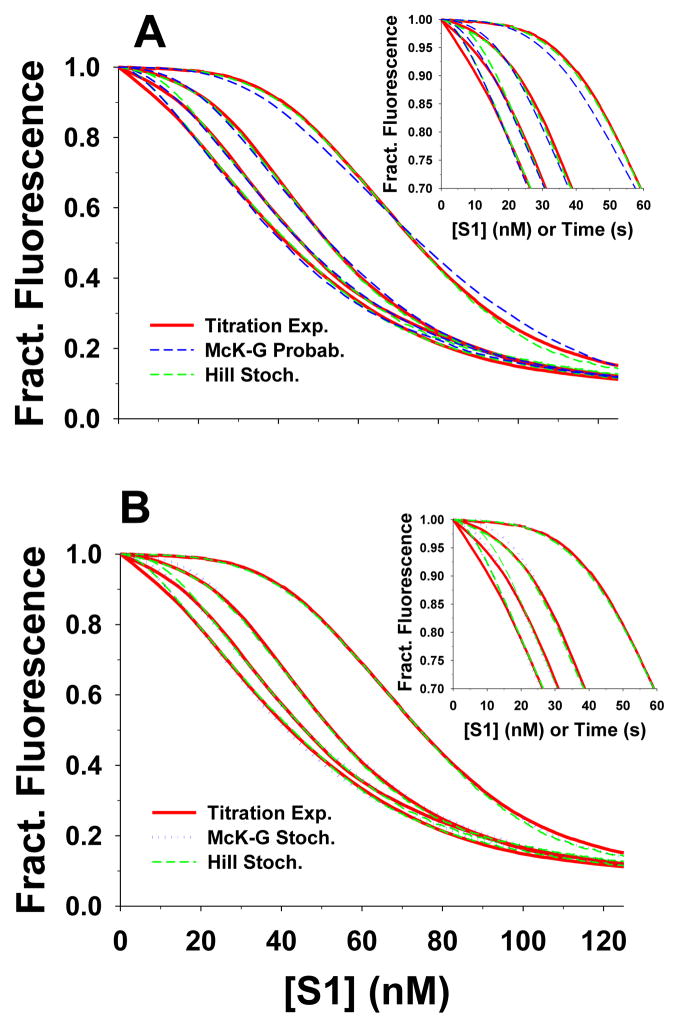
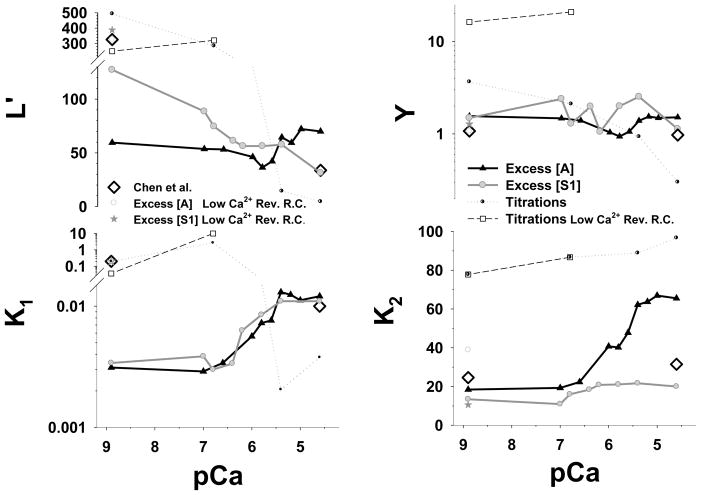
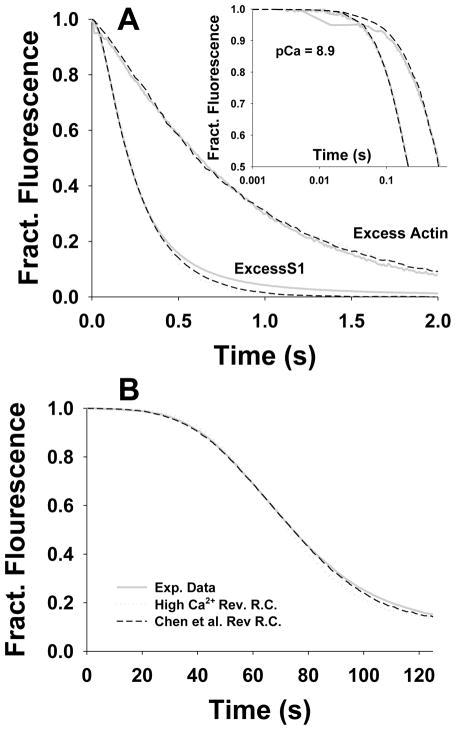
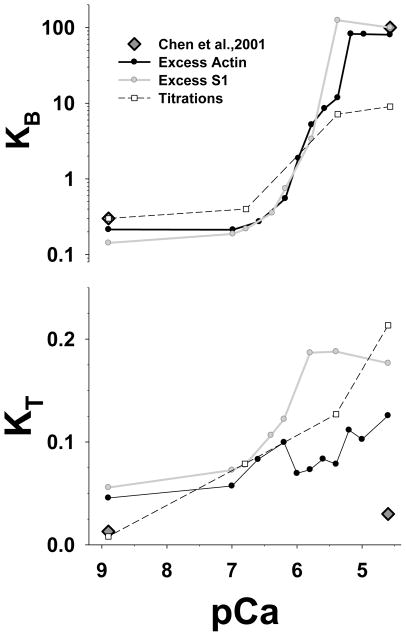
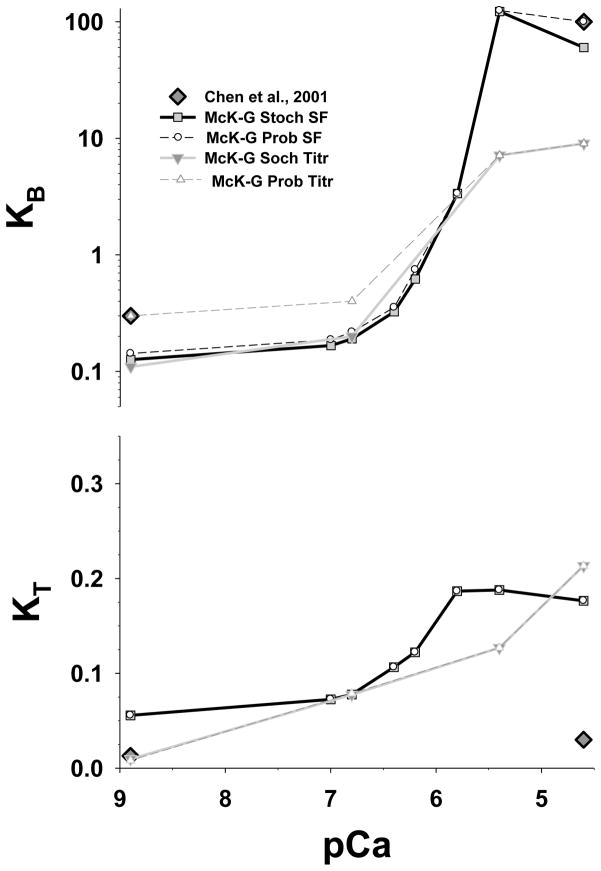
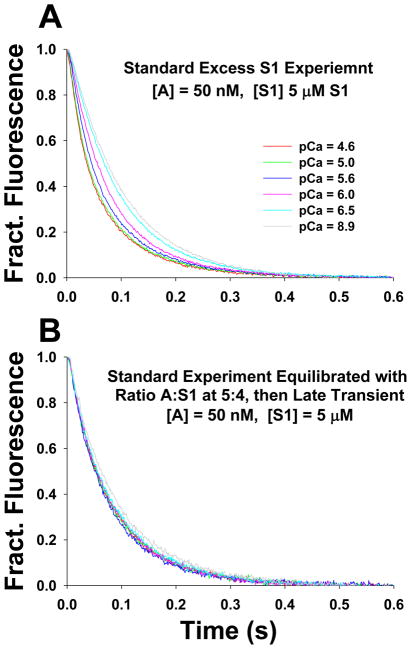
The Hill two-state cooperativity model and the McKillop-Geeves (McK-G) three-state model predict very similar binding traces of myosin subfragment 1 (S1) binding to regulated actin filaments in the presence and absence of calcium, and both fit the experimental data reasonably well [Chen et al., Biophys. J., 80, 2338-2349]. Here, we compared the Hill model and the McK-G model for binding myosin S1 to regulated actin against three sets of experimental data: the titration of regulated actin with S1 and the kinetics of S1 binding of regulated actin with either excess S1 to actin or excess actin to S1. Each data set was collected for a wide range of specified calcium concentrations. Both models were able to generate reasonable fits to the time course data and to titration data. The McK-G model can fit all three data sets with the same calcium-concentration-sensitive parameters. Only K(B) and K(T) show significant calcium dependence, and the parameters have a classic pCa curve. A unique set of the Hill model parameters was extremely difficult to estimate from the best fits of multiple sets of data. In summary, the McK-G cooperativity model more uniquely resolves parameters estimated from kinetic and titration data than the Hill model, predicts a sigmoidal dependence of key parameters with calcium concentration, and is simpler and more suitable for practical use.


Figures

Figure 1
Figure 1
The Hill two-state model schema. (A) A regulated actin filament is structurally composed as sequential repeat of TmTn complex each interacting with seven actin sites. The TmTn complex is denoted as horizontal line and actin monomers on a single F-actin strand are denoted as circles. Each TmTn complex can be in the inactive state (TmTn line down) and in the active state (TmTn line up). The equilibrium between these states in the absence of S1 in solution is solely defined by the Ca2+ concentration. In the presence of S1, the rate of myosin binding to regulated F-actin is regulated by the ratio of the inactive and active states. The binding of S1 (dark gray triangles) is permitted in both inactive and active actin7·TmTn states but it is severely inhibited in inactive state. The nearest-neighbor interactions between two neighboring TmTn units is defined by the interaction energy, wij, between i and j actin7·TmTn states. (B) The kinetic scheme showing the transitions between for actin7·TmTn states (columns), defined by intrinsic equilibrium constant, L = αo/βo, and the kinetics of myosin binding to either inactivated and activated states, defined by equilibrium constants, K1 = k1/k−1 and K2 = k2/k−2 respectively. Here c is the concentration of free S1 in solution, k1 and k2 are S1 binding rate constants, and k−1 and k−2 are rates of unbinding of S1 from F-actin. The transition rate constants of an actin7·TmTn unit between inactive and active states, αm and βm, depends on the number of S1 bound to the unit, m. (C) The cooperativity of TmTn units between inactive and active states depends on the number of the two neighbors that are in State 1, denoted as N1, the interaction energies Y1 = Y11Y12, and δ is a fixed constant between 0 and 1. Note that N1 can have values of 0, 1, or 2. The backward rate constants and other fixed parameters used in all simulations, unless are denoted in the figure legends differently, are taken to be βo = 300 s−1, Y2 = 0.208, k−1 = 500 s−1 and k−2 =0.09 s−1, γ =0.8 and δ =0.5.
Figure 2
Figure 2
Mckillop-Geeves (McK-G) three-state model scheme. In the McK-G model the structural unit, actin7·TmTn, is schematically shown as seven open circles representing the actin monomers connected via a line representing the tropomyosin. This unit exists in a dynamic equilibrium between the three states as represented by the different positions of tropomyosin: the blocked state, AB, in which no myosin-S1 binding can occur, the closed or calcium induced state, AC, in which only weak binding of S1 can occur, and the open or myosin induced state, AM, which allows isomerization of the myosin-S1 to the rigor-like state. The ratio of the three states in the absence of myosin-S1 is defined by the equilibrium constants KB (between the closed and blocked states) and KT (between the closed and open states). The blocked state is only present in the absence of Ca2+ when the Tn complex is tightly bound to the thin filament; in the presence of Ca2+, there is little or no occupancy of the blocked state. Weakly bound myosin states are denoted as A-states (AMMA) and rigor-like states are denoted as R-states (AMMR). The rate of myosin binding is defined by equilibrium constant K1= k1c/k−1, and the rate of isomeration of S1 into R state is defined by equilibrium constant K2 = k2/k−2. Backward rate constants used in all simulations are taken to be kB = 100 s−1, kT = 3000 s−1, k−1 = 10 s−1 and k−2 =5 s−1. Also the equilibrium constants were fixed over all simulations, unless is denoted differently in the figure legends are: K1 = 0.22 μM−1 and K2 = 200.
Figure 3
Figure 3
Model predictions of stopped flow fluorescence transient for S1 binding to regulated pyrene actin at high (pCa 4.6) and low (pCa 8.9) calcium concentrations. The stopped flow transient data (red lines) agreed well with predictions of Hill’s Model (blue line), as well as with the McKillop-Geeves probabilistic and stochastic models (dashed dark green and solid green lines, respectively): A) for excess F-actin (2.5 μM pyrene actin) vs 0.25 μM S1 after mixing; and B) for excess S1 (5 μM) vs 0.5 μM pyrene actin. The slowing of myosin binding at higher level of occupancy of actin by S1s can be only predicted by including negative cooperativity (see methods) into the model, as demonstrated by the fit of McK-G stochastic model (solid green lines).
Figure 4
Figure 4
The best fits of titrations of 50 nM pyr-actin-phalloidin with S1 in the presence of TmTn (0.1 μM) using the Hill and McKillop-Geeves models. The titration time courses of four calcium concentrations (pCa 4.6, 5.4, 6.8 and 8.9) are shown as red lines; in all experiments actin concentration was 50 nM and rate S1 injection rate was 1nM/s. The predictions of the Hill model are denoted as green dashed line, whereas the predictions of McK-G (probabilistic and stochastic) model are denoted as blue dotted lines. The backward rate constants of McK-G model are the same as denoted in Fig. 2. A) Predictions of the Hill model and McK-G probabilistic model and B) predictions of the Hill and McK-G stochastic model.
Figure 5
Figure 5
Estimated Hill model parameters L′, Y, K1 and K2 from the best fits of stopped flow and the titration data are plotted vs. pCa. The parameters L′ and K1 are plotted on a log scale whereas Y and K2 are plotted on a linear scale. The black line with filled triangle up symbols is best fit of the excess actin data set, the grey line with grey filled circle symbols is the best fit the excess S1 data, and the black doted line with semi-filled circle symbols is the best fit of the titrations. The reverse constants β0 =300 s−1, k−1 =500 s−1, k−2 =0.09 s−1 and Y2 = 0.208 are kept the same in all simulations. For comparison we also plotted parameters estimated by Chen et al. from different data sets (open black diamonds). Chen used in his fitting scheme different values for the reverse constants k−1 and Y2 at low Ca2+ concentration, denoted as “Low Ca2+ Rev. R.C.”, having values of 3 s−1 and 0.0703 respectively. The estimated parameters for these reverse constants are denoted grey open circles for the excess actin, as dark grey stars for the excess S1, and as black dashed line with open square symbols for titrations.
Figure 6
Figure 6
The comparative best fits of stopped flow and titration data at low [Ca2+] (grey solid lines) by the Hill model for the two sets of reverse constants: (i) High [Ca2+] reverse rate constants k− 1 =500 s−1, Y2= 0.208 denoted as dark gray dotted lines and (ii) Chen’s reverse rate constants at low [Ca2+] k−1 = 3 s−1 and Y2 =0.0703 denoted as black dashed lines. A) For the excess F-actin (2.5 μM pyrene actin) vs 0.25 μM S1 after mixing and for the excess S1 (5 μM) vs. 0.5 μM pyrene actin both at pCa=8.9. B) For titrations at pCa=8.9.
Figure 7
Figure 7
Estimated McKillop-Geeves (probabilistic) model parameters KB and KT from the best fits to the stopped flow and the titration data are plotted vs. pCa. The unit size in all simulations is N=7. The parameter KB is plotted on a log scale whereas KT is plotted on a linear scale. The black line is best fit of the excess actin data set, the grey line is the best fit to the excess S1 transient, and the black dashed line with open square symbols is the best fit of the titration data. Dark grey diamonds are the data from Chen et al.
Figure 8
Figure 8
Estimated McKillop-Geeves parameters KB and KT from the best fits of the stochastic cooperative model predictions to stopped flow data for the excess [S1] to [actin] and for titrations as a function of pCa. The unit size in all simulations is N=7. The black line with grey filled square symbols is best fit by McK-G stochastic model of the stopped flow excess S1 data set, the grey line with grey triangle (down) symbols is the best fit the titration data set. For comparison KB and KT estimated from the probabilistic McK-G model are show as black dashed line with circle open symbols for the parameters estimated from the stopped flow excess [S1] and from the titration data sets are denoted by dark grey dashed line with triangle up symbols. Dark grey diamonds are the data from Chen et al.
Figure 9
Figure 9
Stopped flow transients of mixing excess of S1 with pyrene actin to quantitatively demonstrate the calcium independent slowing of S1 binding at higher occupancy of actin sites by bound S1. A) The excess S1 stopped flow experiment: 5 μM S1 was quickly mixed with 50 nM pyrene actin in presence of 20 nM TmTn. B) Excess S1 stopped flow experiment repeated with actin preloaded with S1 at 5:4 ratio of A:S1. 50 nM pyrene actin was equilibrated with 40 nM S1 in presence of 20 nM TmTn and then rapidly mixed with 5 μM S1. The same pCa values and color codes were used as in A.

References

    1. Chen Y, Yan B, Chalovich JM, Brenner B. Theoretical kinetic studies of models for binding myosin subfragment-1 to regulated actin: Hill model versus Geeves model. Biophys J. 2001;80:2338–49. - PMC - PubMed
    1. Vibert P, Craig R, Lehman W. Steric-model for activation of muscle thin filaments. J Mol Biol. 1997;266:8–14. - PubMed
    1. Smith DA, Maytum R, Geeves MA. Cooperative regulation of myosin-actin interactions by a continuous flexible chain I: actin-tropomyosin systems. Biophys J. 2003;84:3155–67. - PMC - PubMed
    1. Trybus KM, Taylor EW. Kinetic studies of the cooperative binding of subfragment 1 to regulated actin. Proc Natl Acad Sci U S A. 1980;77:7209–13. - PMC - PubMed
    1. Geeves MA, Halsall DJ. Two-step ligand binding and cooperativity. A model to describe the cooperative binding of myosin subfragment 1 to regulated actin. Biophys J. 1987;52:215–20. - PMC - PubMed

Publication types

LinkOut - more resources