. 2012 Feb 5;8(3):301-10.
doi: 10.1038/nchembio.780.

Small-molecule-induced DNA damage identifies alternative DNA structures in human genes

Affiliations

Small-molecule-induced DNA damage identifies alternative DNA structures in human genes

Raphaël Rodriguez et al. Nat Chem Biol. .

Abstract

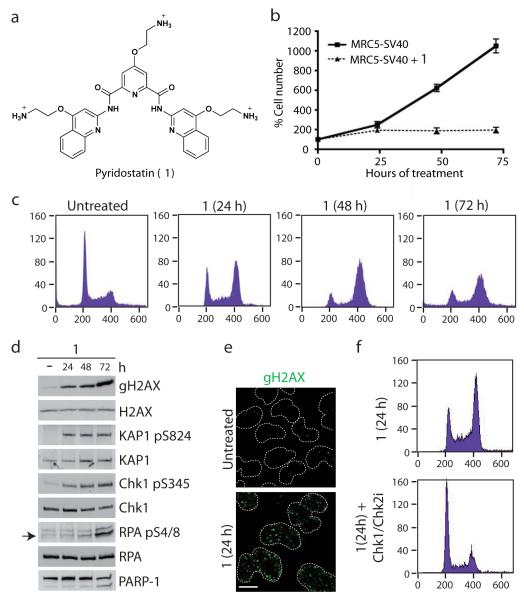
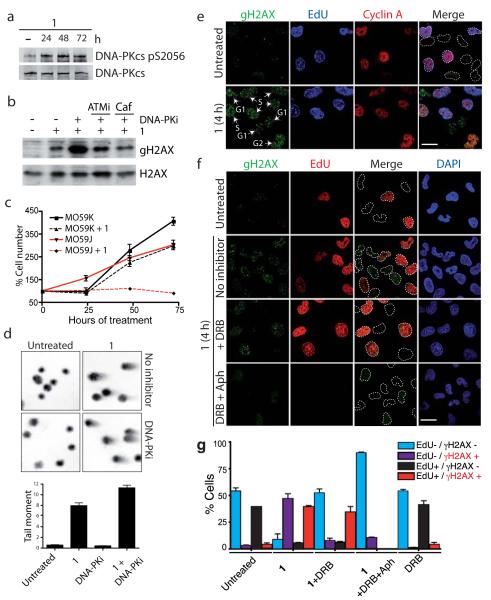
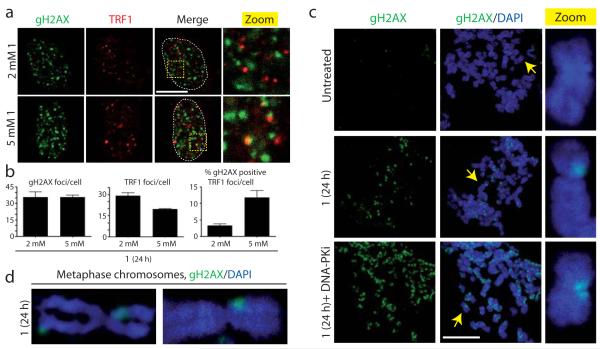
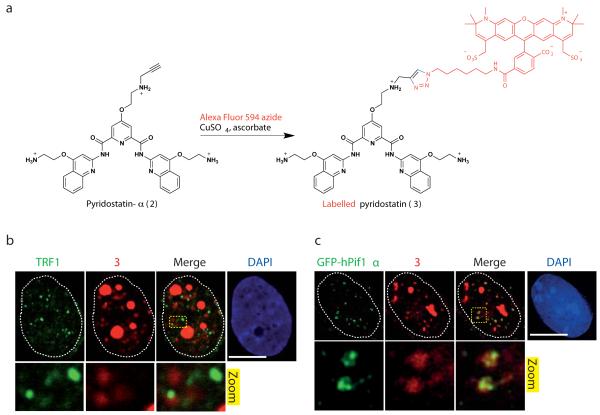
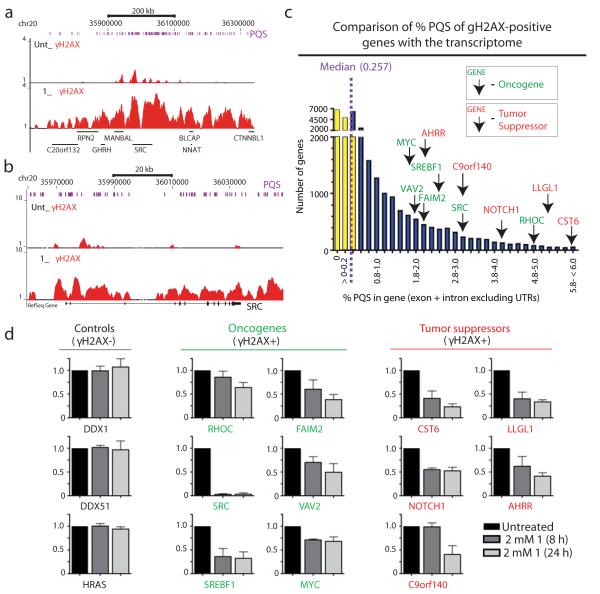
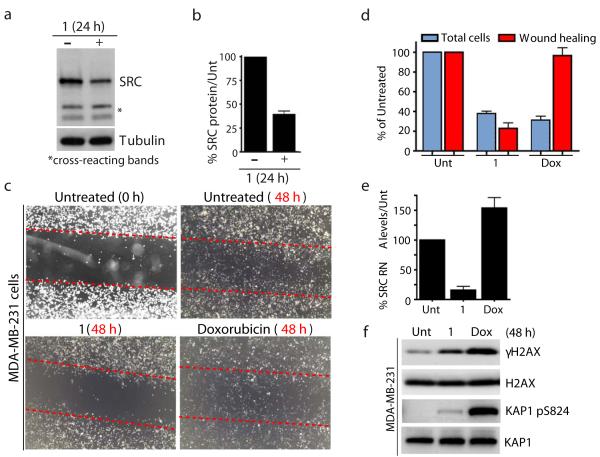
Guanine-rich DNA sequences that can adopt non-Watson-Crick structures in vitro are prevalent in the human genome. Whether such structures normally exist in mammalian cells has, however, been the subject of active research for decades. Here we show that the G-quadruplex-interacting drug pyridostatin promotes growth arrest in human cancer cells by inducing replication- and transcription-dependent DNA damage. A chromatin immunoprecipitation sequencing analysis of the DNA damage marker γH2AX provided the genome-wide distribution of pyridostatin-induced sites of damage and revealed that pyridostatin targets gene bodies containing clusters of sequences with a propensity for G-quadruplex formation. As a result, pyridostatin modulated the expression of these genes, including the proto-oncogene SRC. We observed that pyridostatin reduced SRC protein abundance and SRC-dependent cellular motility in human breast cancer cells, validating SRC as a target of this drug. Our unbiased approach to define genomic sites of action for a drug establishes a framework for discovering functional DNA-drug interactions.


Figures

Figure 1
Figure 1. Pyridostatin-induced DNA damage and checkpoint-dependent cell cycle arrest
(a) Molecular structure of 1; trifluoromethanesulfonate counter anions are omitted for clarity. (b) 1 inhibited cell proliferation (N=3; error bars represent S.E.M.). (c) 1 caused cell accumulation in G2; cells were analyzed by FACS with cell count (y-axis) and DNA content (x-axis) as indicated. (d) 1 activated DDR signalling; western blots were performed with the indicated antibodies. Full gel images are displayed in Supplementary Fig. 2. (e) γH2AX foci induced by 1; cells were treated and analyzed by immunofluorescence (IF); dotted white lines indicate nuclear peripheries. (f) G2/M checkpoint-dependent arrest induced by 1; cells were analyzed as in Fig. 1c 2h after addition of Chk1/Chk2i. MRC5-SV40 cells were used throughout all Figures and were either untreated or treated with 2 μM 1 during 24 h unless otherwise stated. Scale bar, 10 μm.
Figure 2
Figure 2. Pyridostatin-induced transcription- and replication-dependent DNA damage
(a) 1 activated DNA-PKcs; cells were analyzed as in Fig. 1d. (b) DNA-PKcs inhibition enhanced γH2AX formation in cells treated with 1 in an ATM-dependent manner; cells were pre-treated with the indicated inhibitors for 1 h before treatment with 1. Full gel images are displayed in Supplementary Fig. 4. (c) DNA-PKcs deficient MO59J cells were hypersensitive to 1; analysis was as in Fig. 1b. (d) DSB induced by 1; neutral comet assays were done in the presence or absence of 1 and DNA-PKi, tail moments were determined as described in Methods (N=3; error bars represent S.E.M.). (e) DNA damage in G1, S and G2 phases; cells were treated with 20 μM 1 for 4 h and analyzed as indicated, cell cycle phases are indicated with white arrows and labels, dotted white lines indicate nuclear peripheries; S phase cells are positive for EdU and Cyclin A, G2 cells are positive for Cyclin A only, while G1 cells are negative for EdU and Cyclin A. Scale bar, 20 μm. (f) DNA damage was prevented by transcription (DRB) and replication (Aph) inhibition; cells were pre-treated with inhibitors prior to addition of 20 μM 1 for 4 h; white arrows in cell treated with DRB and 1 indicate G1/G2 cells that are γH2AX-negative; dotted white lines indicate nuclear peripheries. Scale bar, 20 μm. (g) Quantification of cells in experiment Fig. 2f (N=3; >100 cells scored/condition/replica; error bars represent S.E.M; note that Aph prevents EdU incorporation).
Figure 3
Figure 3. Visual analysis of pyridostatin targets
(a) DNA damage signals induced by 1 were mainly non-telomeric; cells were analyzed as in Fig. 1e; areas within dotted lines denote nuclear DNA. Scale bar, 10 μm; zoomed images correspond to 4X magnifications of main images. (b) Quantification of experiment in Fig. 3a. N=3; >100 cells scored/condition/replica; error bars represent S.E.M. (c) γH2AX foci induced by 1 mainly marked non-telomeric sites on mitotic chromosomes; yellow arrows indicate chromosomes corresponding to the magnified images in the zoom column. Scale bar, 20 μm; zoomed images correspond to further 8X magnification (d) Zoomed images of damaged mitotic chromosomes from cells treated with 1 as in (c).
Figure 4
Figure 4. Pyridostatin and hPif1 targeted overlapping sites in cells
(a) Molecular structure of 2 and synthetic scheme for generating 3 in cells; a single isomer is shown for clarity, Alexa Fluor 594 is marked in red and newly formed chemical bonds are marked in blue. (b) 3 formed nuclear foci mainly at non-telomeric sites in MRC5-SV40 cells, fixed with formaldehyde prior to incubation with 2 followed by chemical labelling; dotted white lines indicate nuclear peripheries; zoomed images correspond to further 4X magnification. (c) GFP-hPif1α expressing U2OS cells display small nuclear foci of GFP-hPif1α that co-localizes with 3 in cells fixed with formaldehyde prior to incubation with 2 followed by chemical labelling; dotted white lines indicate nuclear peripheries; zoomed images correspond to further 5X magnification. Note that cells were first pre-extracted with CSK buffer as described in Supplementary Methods, then fixed with formaldehyde and stained with the indicated antibody. Scale bar, 10 μm.
Figure 5
Figure 5. ChIP-Seq analysis identified genomic targets of pyridostatin
(a) ChIP-Seq (Supplementary Methods) identified γH2AX regions in oncogenes and tumor suppressors containing PQS clusters; cells were treated with 2 μM 1 during 24h; γH2AX ChIP-Seq of chromosomal region containing SRC is shown (zoomed view in b); chromosome locations and transcripts are shown; purple bars represent mapped PQS (Supplementary Methods). (c) γH2AX-positive oncogenes and tumor suppressors; transcriptome was plotted; purple-dashed line indicates the median % PQS value; yellow bars represent genes below median value and blue bars the genes above median value. Note that all γH2AX-positive genes exhibit higher PQS contents compared to the median value. (d) 1 down-regulated the mRNAs of genes in which it induces γH2AX. Total RNA was purified then reversed transcribed and analyzed by quantitative qRT-PCR for the indicated genes. Expression data for each gene are graphed, with the y-axis indicating expression data for each gene normalized to the housekeeping genes ALAS1 and B2M, and then normalized to untreated samples (N=3; error bars represent S.E.M.). Data from untreated, 8 h and 24 h treated samples are shown for each gene.
Figure 6
Figure 6. Pyridostatin interacted with G-quadruplex motifs in SRC
(a) Sequence of a PQS identified in SRC; guanines able to form G-quartet highlighted in bold. Below is a CD spectrum of this sequence pre-annealed in potassium-containing buffer; the molar ellipticity exhibits a positive signal at 265 nm and a negative signal at 240 nm characteristic of a folded parallel G-quadruplex structure (Supplementary Methods). (b) The lower panel displays the NMR spectrum of the free sequence pre-annealed in potassium containing buffer, which exhibits 12 imino proton signals between 11.0 and 12.0 ppm characteristic of a G-quadruplex structure (Supplementary Methods); red arrows indicate proton signals characteristic of the top G-quartet; schematic representation of a free parallel G-quadruplex with loops in black lines and G-quartets in purple. The upper panel displays the NMR spectrum of the G-quadruplex DNA obtained after addition of 1.1 mole equivalents of 1, which exhibits a shift up-field of the imino proton signals compared to untreated sample; schematic representation of 1 (grey) bound to the top G-quartet of the G-quadruplex motif.
Figure 7
Figure 7. Pyridostatin targeted the proto-oncogene SRC
(a) Treatment with 1 reduced SRC protein levels; cells were analyzed as in Fig. 1d; cross-reacting bands and tubulin provide loading controls. Full gel images are displayed in Supplementary Fig. 16. (b) Quantification of SRC protein levels upon treatment with 1. SRC quantification from 3 independent experiments was performed using LI-COR Odyssey infrared imaging (LI-COR Biosciences) as described in Supplementary Methods. Error bars represent S.E.M. (c) 1 reduced migration of MDA-MB-231 cells. Migration was assessed by wound healing; dotted red lines denote the edges of the wound area; cells were analyzed 48 h after creating the wound for untreated, 1 (2 μM) and doxorubicin (Dox, 100 nM) treatments, images were captured at 20X with a light microscope. (d) Quantification of experiment in Fig. 7c; cells within equal wound areas for each treatment were trypsinized and counted in duplicate dish for each treatment; data are normalized to untreated samples and represent 3 independent experiments (error bars = S.E.M.). (e) 1 reduced SRC mRNA levels in MDA-MB-231 cells. Untreated, and cells treated with 1 (2 μM) and Dox (100 nM) were taken at 24 h and SRC RNA levels determined as in Fig. 5d. (f) 1 and Dox triggered DNA damage in MDA-MB-231 cells. Untreated, and cells treated with 1 (2 μM) and Dox (100 nM) were collected 48 h post-treatment; proteins were analyzed as in Fig. 1d with the indicated antibodies. Full gel images are displayed in Supplementary Fig. 16.

Comment in

References

    1. Dervan PB. Design of sequence-specific DNA-binding molecules. Science. 1986;232:464–71. - PubMed
    1. Stockwell BR. Chemical genetics: ligand-based discovery of gene function. Nat. Rev. Genet. 2000;1:116–25. - PMC - PubMed
    1. Thomas JR, Hergenrother PJ. Targeting RNA with small molecules. Chem. Rev. 2008;108:1171–224. - PubMed
    1. Gottesfeld JM, Neely L, Trauger JW, Baird EE, Dervan PB. Regulation of gene expression by small molecules. Nature. 1997;387:202–5. - PubMed
    1. Todd AK, Johnston M, Neidle S. Highly prevalent putative quadruplex sequence motifs in human DNA. Nucleic Acids Res. 2005;33:2901–7. - PMC - PubMed

Publication types

MeSH terms