. 2012 Feb 5;44(3):243-6.
doi: 10.1038/ng.1074.

Differential confounding of rare and common variants in spatially structured populations

Affiliations

Differential confounding of rare and common variants in spatially structured populations

Iain Mathieson et al. Nat Genet. .

Abstract

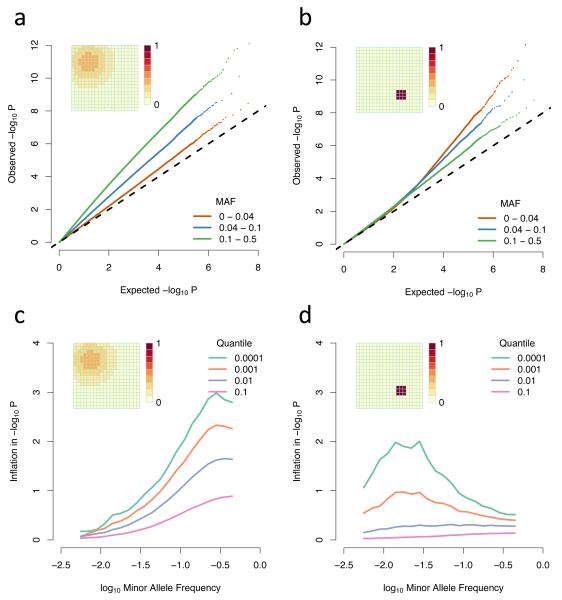
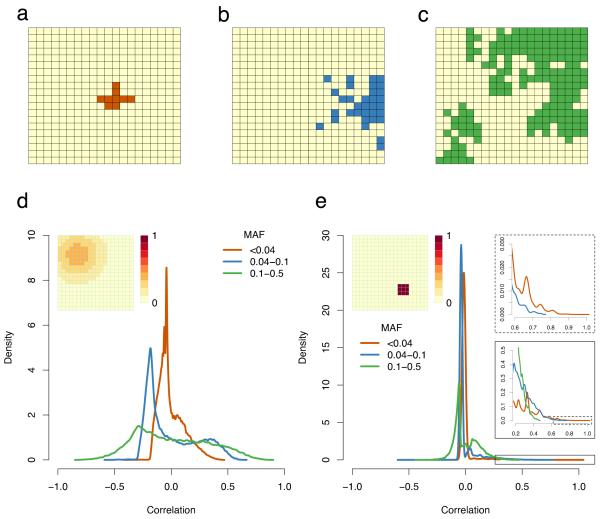
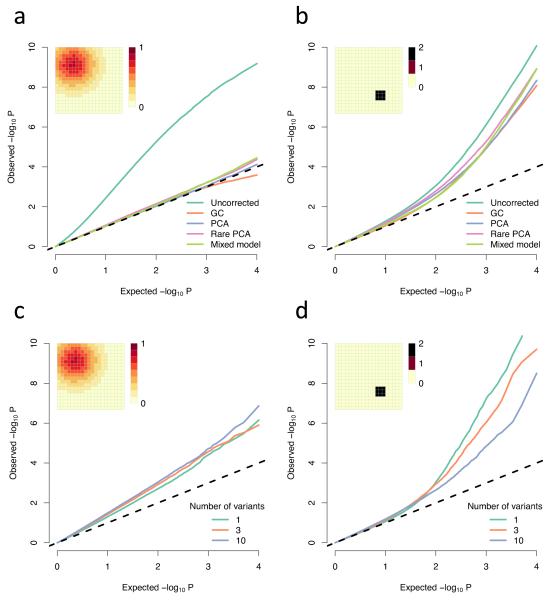
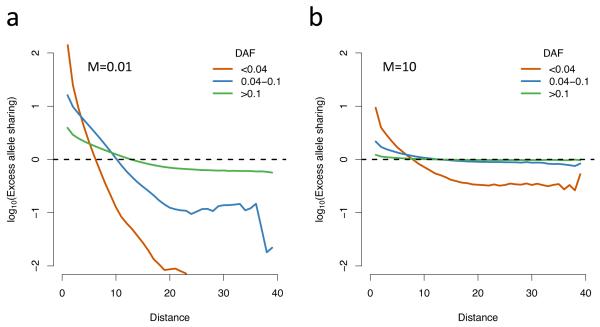
Well-powered genome-wide association studies, now made possible through advances in technology and large-scale collaborative projects, promise to characterize the contribution of rare variants to complex traits and disease. However, while population structure is a known confounder of association studies, it remains unknown whether methods developed to control stratification are equally effective for rare variants. Here, we demonstrate that rare variants can show a stratification that is systematically different from, and typically stronger than, common variants, and this is not necessarily corrected by existing methods. We show that the same process leads to inflation for load-based tests and can obscure signals at truly associated variants. Furthermore, we show that populations can display spatial structure in rare variants, even when Wright's fixation index F(ST) is low, but that allele frequency-dependent metrics of allele sharing can reveal localized stratification. These results underscore the importance of collecting and integrating spatial information in the genetic analysis of complex traits.


Figures

Figure 1
Figure 1. Differential inflation of rare and common variants
(a-b) QQ plots of association test P-values, broken down by allele frequency for (a) a broad, smoothly (Gaussian) varying non-genetic risk factor and (b) a small, sharply defined region of constant non-genetic risk; (c-d) Inflation plots showing the amount by which the observed −log10 P-value exceeds the expected value across allele frequencies. Different lines represent different levels of significance, with −log10 P-value equal to 1,2,3 or 4; The grids in the top left of the pictures represent the spatial distribution of risk and the scale indicates by how many standard deviations the phenotypic mean is shifted in each grid square. The populations simulated here are uniformly distributed over the grid, with two individuals in each square, and a migration rate of 0.01.
Figure 2
Figure 2. Spatial distribution of rare and common variants
(a-c) Examples from simulations of the spatial distribution of (a) rare, (b) low frequency and (c) common variants. In each case, grid squares where the allele is present are in colour; (d-e) The distribution of the correlation coefficient between genotypes and non-genetic risk for rare, low frequency and common variants. These are kernel density estimates of the distribution of the correlation between genotypic value (0/1) and associated environmental risk for individuals from the simulations described in Figure 1; (d) Gaussian risk; (e) Small, sharply defined risk. The inset panels in e show successive enlargements of the boxed areas in the tail of the distribution. All parameters are the same as in Figure 1. Abbreviations: MAF: minor allele frequency.
Figure 3
Figure 3. Comparison of methods for correcting for population structure
(a-b) QQ plots of −log10 P-values showing the uncorrected values and the values under different corrections; (c-d) Simulated rare variant load tests (Online methods); All parameters are the same as in Figure 1, except the non-genetic risk is doubled so for the Gaussian risk a and c the phenotypic mean is shifted by at most 0.8 standard deviations, while for the small, sharp risk in b and d it is shifted by at most 2 standard deviations; These are both averaged over multiple simulations in order to show the average effect. Individual experiments may vary due to the sampling variance of the trait. (a-b) averaged over 100 simulations, each testing one trait at 10,000 loci in total (10 loci on each of 1000 genealogies, representing independent genomic regions). (c-d) averaged over 10 simulations, each one testing 10,000 genealogies with either 1,3, or 10 variants in each; Abbreviations: GC, genomic control; PCA principal component analysis, using the first 10 principal components; Rare PCA, as PCA but using only variants with MAF < 4%.
Figure 4
Figure 4. Excess allele sharing
A ratio measuring how much more likely two individuals at a given spatial distance are to share a derived allele, compared to what would be expected in a homogenous population (Methods). The parameters are the same as those used in Figure 1, apart from migration rate, which is (a) M=0.01, (b) M=10; In a, FST=0.1 and in b, FST<0.01; Abbreviations: DAF: derived allele frequency.

Comment in

References

    1. Manolio TA, et al. Finding the missing heritability of complex diseases. Nature. 2009;461:747–753. - PMC - PubMed
    1. Bodmer W, Bonilla C. Common and rare variants in multifactorial susceptibility to common diseases. Nat. Genet. 2008;40:695–701. - PMC - PubMed
    1. Spencer CC, Su Z, Donnelly P, Marchini J. Designing genome-wide association studies: sample size, power, imputation, and the choice of genotyping chip. PLoS Genet. 2009;5:e1000477. - PMC - PubMed
    1. Nejentsev S, Walker N, Riches D, Egholm M, Todd JA. Rare variants of IFIH1, a gene implicated in antiviral responses, protect against type 1 diabetes. Science. 2009;324:387–389. - PMC - PubMed
    1. Cohen JC, et al. Multiple rare alleles contribute to low plasma levels of HDL cholesterol. Science. 2004;305:869–872. - PubMed

Publication types