. 2012 Feb;9(1):016002.
doi: 10.1088/1478-3975/9/1/016002. Epub 2012 Feb 3.

Cytometric comparisons between circulating tumor cells from prostate cancer patients and the prostate-tumor-derived LNCaP cell line

Affiliations

Cytometric comparisons between circulating tumor cells from prostate cancer patients and the prostate-tumor-derived LNCaP cell line

Daniel C Lazar et al. Phys Biol. 2012 Feb.

Abstract

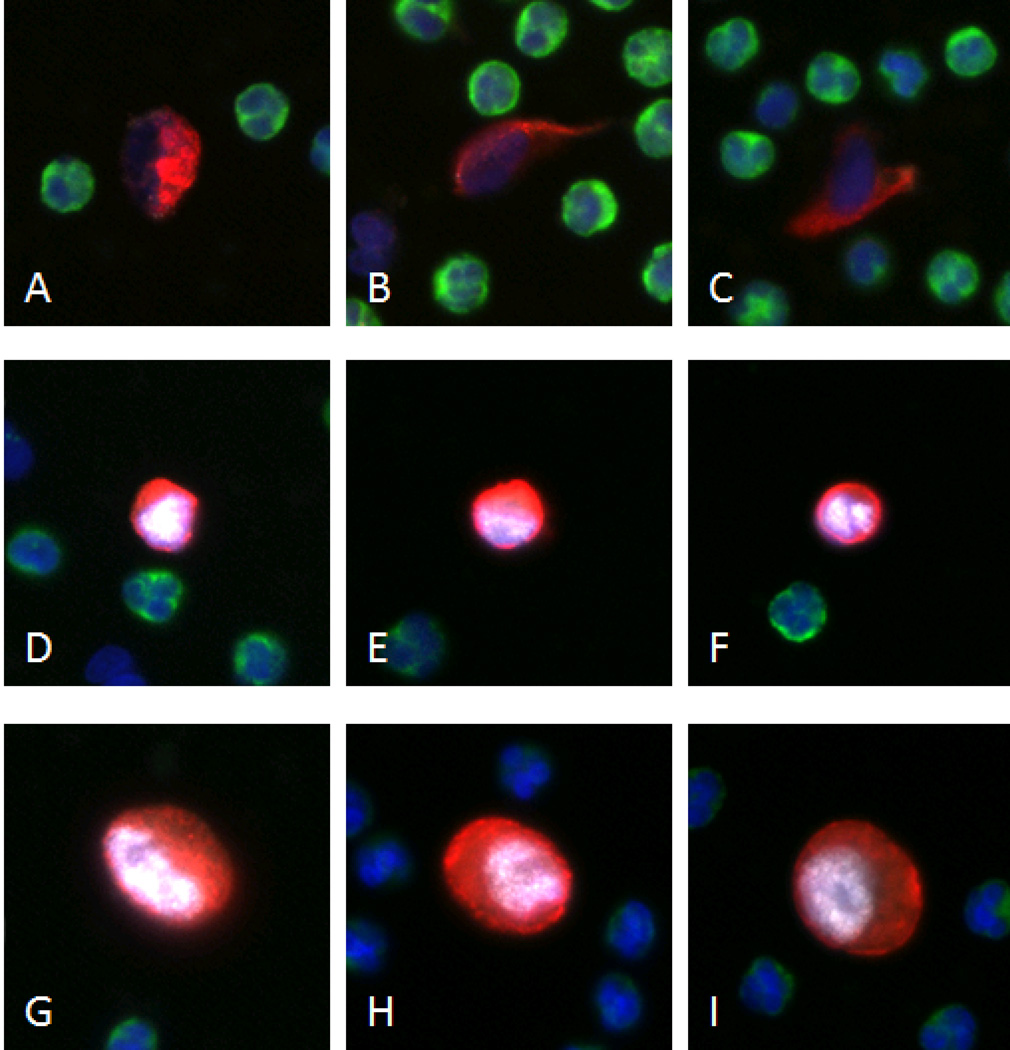
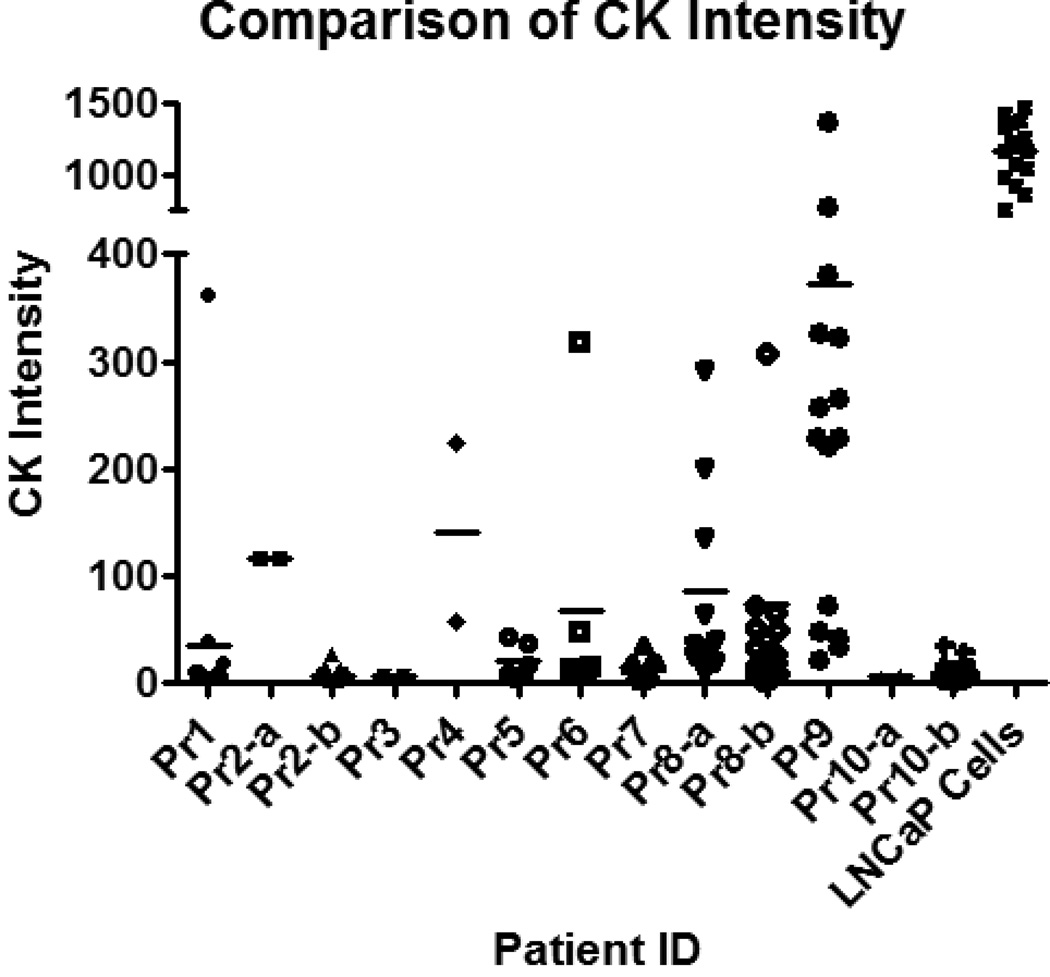
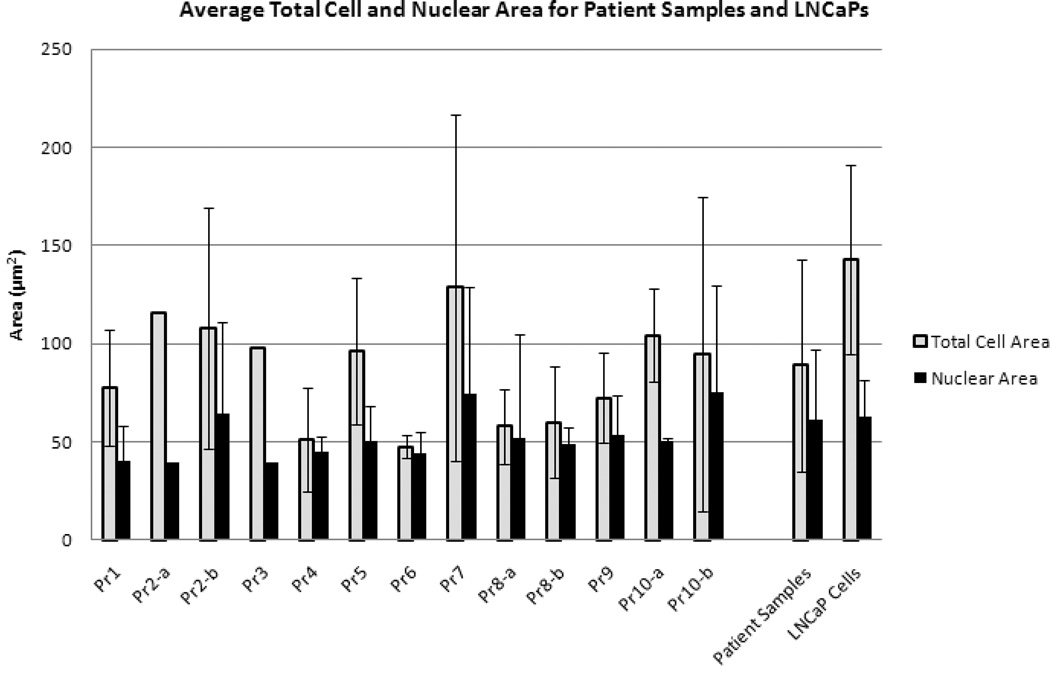
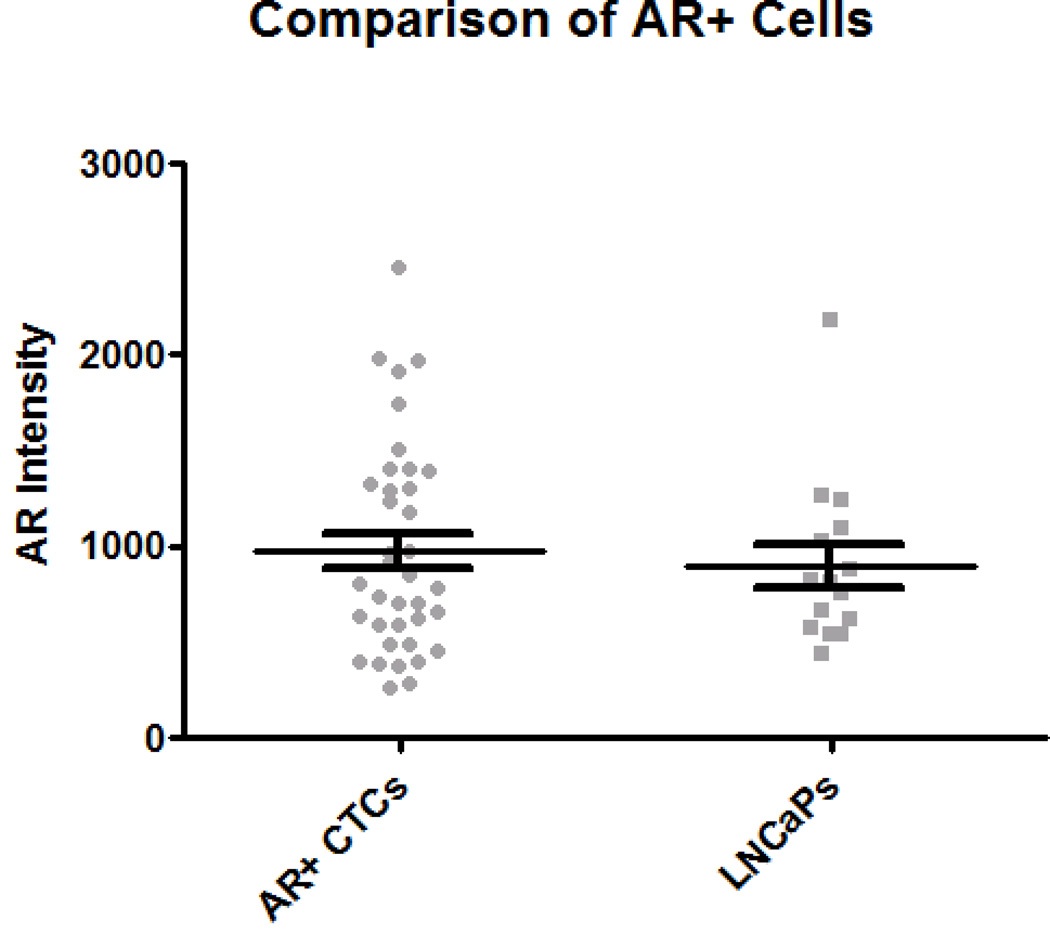
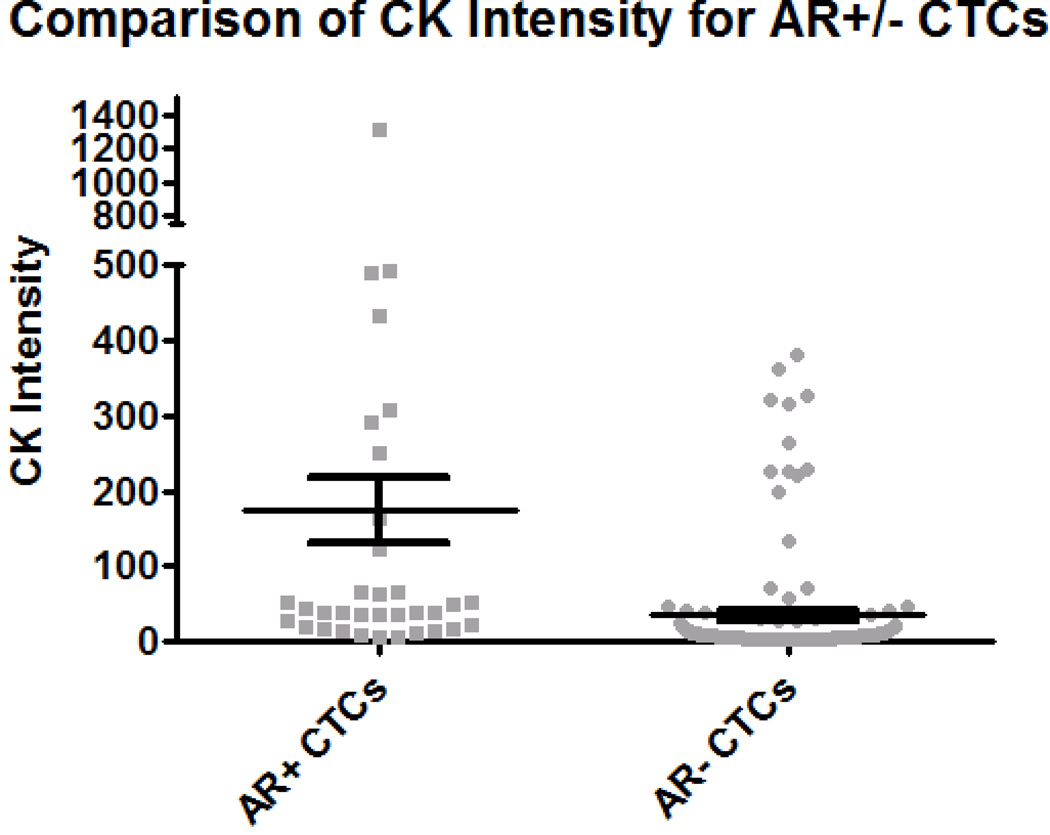
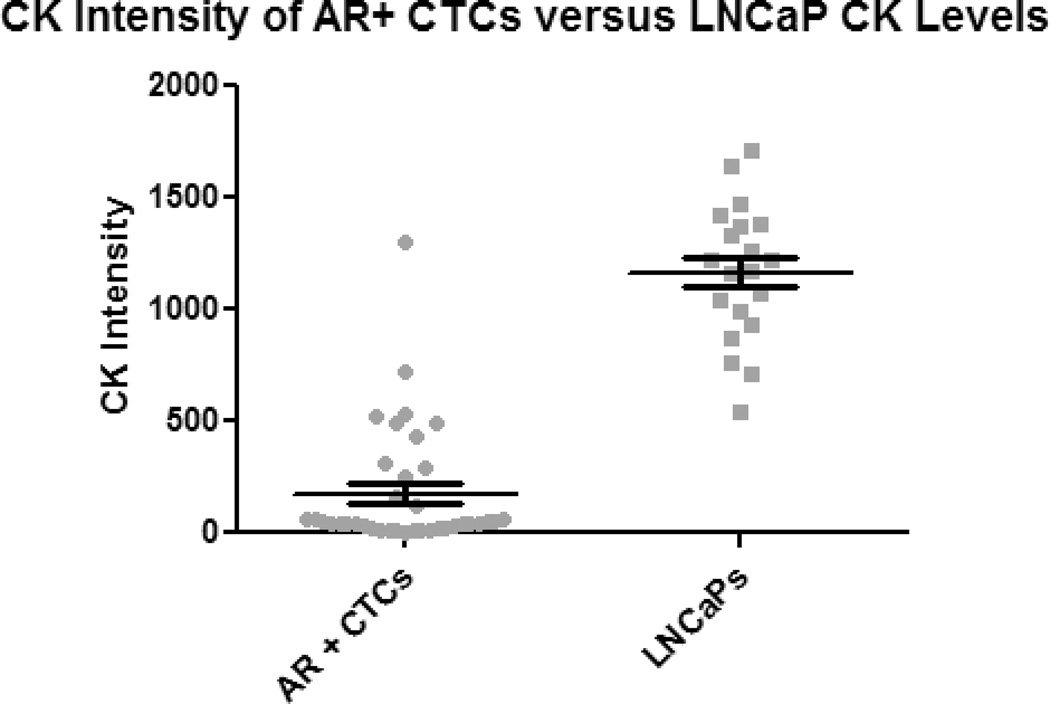
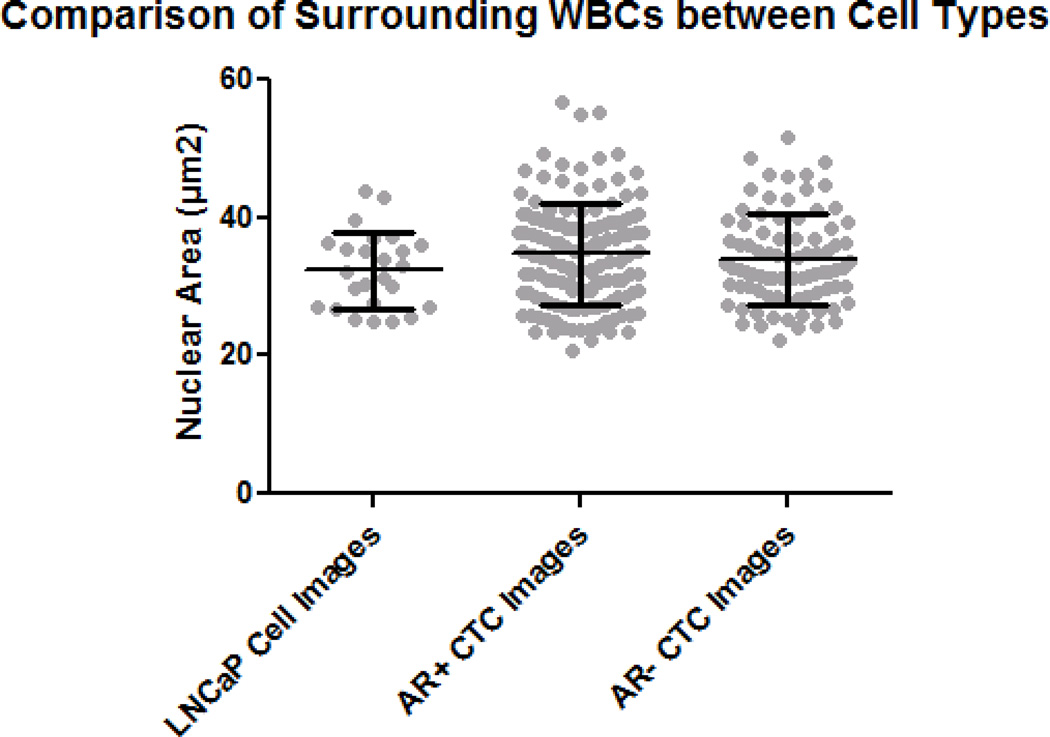
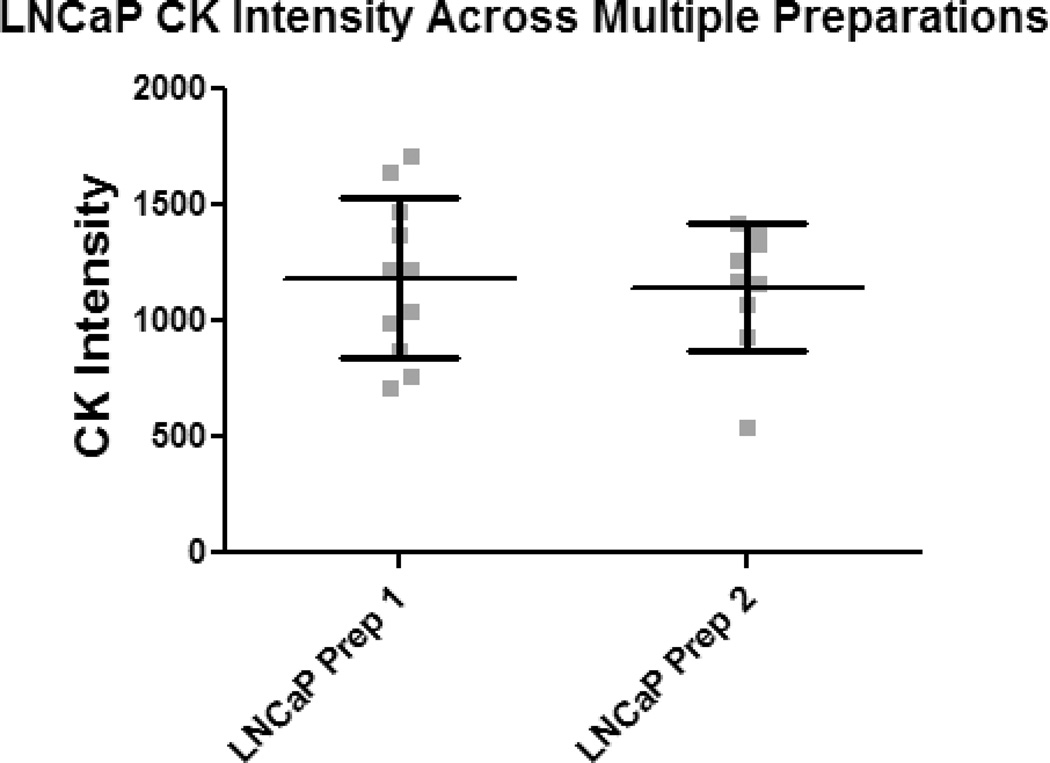
Many important experiments in cancer research are initiated with cell line data analysis due to the ease of accessibility and utilization. Recently, the ability to capture and characterize circulating tumor cells (CTCs) has become more prevalent in the research setting. This ability to detect, isolate and analyze CTCs allows us to directly compare specific protein expression levels found in patient CTCs to cell lines. In this study, we use immunocytochemistry to compare the protein expression levels of total cytokeratin (CK) and androgen receptor (AR) in CTCs and cell lines from patients with prostate cancer to determine what translational insights might be gained through the use of cell line data. A non-enrichment CTC detection assay enables us to compare cytometric features and relative expression levels of CK and AR by indirect immunofluorescence from prostate cancer patients against the prostate cancer cell line LNCaP. We measured physical characteristics of these two groups and observed significant differences in cell size, fluorescence intensity and nuclear to cytoplasmic ratio. We hope that these experiments will initiate a foundation to allow cell line data to be compared against characteristics of primary cells from patients.


Figures

Figure 1
Figure 1. A representative gallery of CTCs and LNCaPs
For all cells, blue, green, red, and white represent DAPI, CD45, CK, and AR respectively. Panels A-C show CTCs classified as AR−, and panels D–F were all deemed AR+ CTCs. Images G–I represent typical LNCaP cell-line cells being always CK and AR positive.
Figure 2
Figure 2. CK expression of CTCs is less than that of LNCaPs
The CK intensity of each CTC and LNCaP cell is shown here. For most patients, the CK levels for all CTCs are below 500, while all LNCaP cells had intensities above 500. Using the Dunnett’s Multiple Comparison Test, the difference in CK intensity between CTCs and LNCaPs was significant (p<0.0001). Error bars represent standard error of the mean (SEM).
Figure 3
Figure 3. Comparison of Cytomorphic Features
The average total cell and nuclear areas for each patient as well as the LNCaP cells are presented. The average nuclear area of the patient samples is similar to that of the LNCaP cells; however, LNCaP cells on average have a greater total cell area, which in turn results in a smaller N/C ratio than CTCs. Error bars represent standard deviation.
Figure 4
Figure 4. Comparison of AR+ CTCs to LNCaP cells and AR− CTCs
(A) For the 37 AR+ CTCs, the AR intensity is not significantly different than the AR intensity of the LNCaPs (p=.824). (B) The mean CK intensity for AR+ CTCs was then compared to the AR− CTCs. A significant difference was found between these two populations (p<0.0001). (C) The CK intensity for this AR+ subset of CTCs was also compared to the CK intensity of LNCaP cells. The difference was still found to be significant. Error bars represent SEM.
Figure 5
Figure 5. Comparison of White Blood Cell (WBC) Areas and LNCaP Intensities
(A) To ensure normalized area measurements between AR+ CTCs, AR− CTCs, and LNCaP cells, WBCs from each preparation were compared. The difference was not found to be significant. (B) To verify CK intensities were consistent between multiple preparations, the CK intensity of LNCaP cells from each preparation were compared. No significant difference was found. Error bars represent SEM.

References

    1. Eccles SA, Welch DR. Metastasis: recent discoveries and novel treatment strategies. Lancet. 2007;369:1742–1757. - PMC - PubMed
    1. Chiang AC, Massagué J. Molecular Basis of Metastasis. N. Engl. J. Med. 2008;359:2814–2823. - PMC - PubMed
    1. Hanahan D, Weinberg RA. The hallmarks of cancer. Cell. 2000;100:57–70. - PubMed
    1. Cristofanilli M, et al. Circulating tumor cells, disease progression, and survival in metastatic breast cancer. N Engl. J. Med. 2004;351:781–791. - PubMed
    1. Nagrath S, et al. Isolation of rare circulating tumour cells in cancer patients by microchip technology. Nature. 2007;450:1235–1239. - PMC - PubMed

Publication types