. 2012 May;1817(5):811-8.
doi: 10.1016/j.bbabio.2012.01.013. Epub 2012 Jan 28.

Tyrosine triad at the interface between the Rieske iron-sulfur protein, cytochrome c1 and cytochrome c2 in the bc1 complex of Rhodobacter capsulatus

Affiliations

Tyrosine triad at the interface between the Rieske iron-sulfur protein, cytochrome c1 and cytochrome c2 in the bc1 complex of Rhodobacter capsulatus

John A Kyndt et al. Biochim Biophys Acta. 2012 May.

Abstract

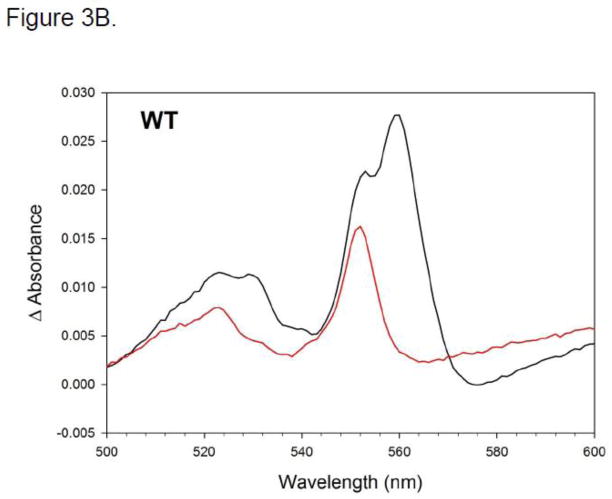
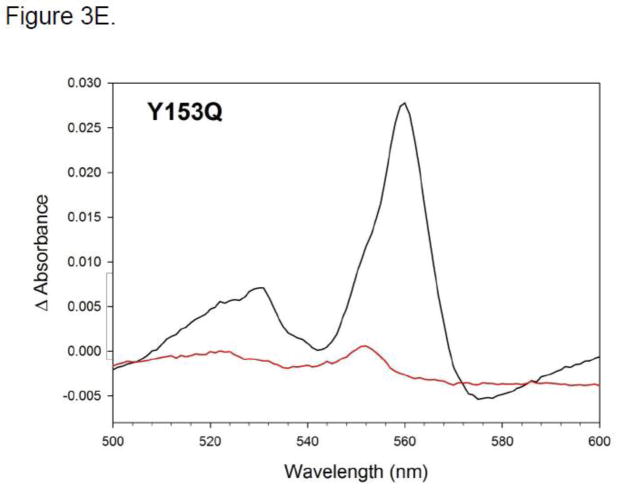
A triad of tyrosine residues (Y152-154) in the cytochrome c(1) subunit (C1) of the Rhodobacter capsulatus cytochrome bc(1) complex (BC1) is ideally positioned to interact with cytochrome c(2) (C2). Mutational analysis of these three tyrosines showed that, of the three, Y154 is the most important, since its mutation to alanine resulted in significantly reduced levels, destabilization, and inactivation of BC1. A second-site revertant of this mutant that regained photosynthetic capacity was found to have acquired two further mutations-A181T and A200V. The Y152Q mutation did not change the spectral or electrochemical properties of C1, and showed wild-type enzymatic C2 reduction rates, indicating that this mutation did not introduce major structural changes in C1 nor affect overall activity. Mutations Y153Q and Y153A, on the other hand, clearly affect the redox properties of C1 (e.g. by lowering the midpoint potential as much as 117 mV in Y153Q) and the activity by 90% and 50%, respectively. A more conservative Y153F mutant on the other hand, behaves similarly to wild-type. This underscores the importance of an aromatic residue at position Y153, presumably to maintain close packing with P184, which modeling indicates is likely to stabilize the sixth heme ligand conformation.


Figures

Figure 1
Figure 1
Alignment of the C1s for which there are 3-dimensional structures: 1. Chicken, 2. Bovine, 3. Yeast, 4. Rb. capsulatus, 5. Rb. sphaeroides. Numbering is for Rb. capsulatus. Note that the bacterial C1s have a large 18-residue insertion in the region of interest, loop 136–201, that contains the sixth heme ligand Met 183 and the tyrosine triad, 152–154. The disulfide bridge, C144–C167 which helps to stabilize the loop, is conserved in Rb. sphaeroides, but not in the eukaryotic C1s. Helices are underlined. The sixth heme ligand is colored blue and the mutated residues are green.
Figure 2
Figure 2
Structural view of the C2-C1-Rieske interface of R. capsulatus BC1, showing the position of the tyrosines (cyan) in the Y-triad. C2 is blue; C1 is yellow, orange and cyan; Rieske protein is green. The extension on C1 as compared to C2 structure is shown in orange and cyan. C1 heme is pink, C2 heme is blue and [2Fe2S] is yellow and orange sticks.
Figure 3
Figure 3
A. SDS-page gel for wild-type R. capsulatus BC1, purified using a TALON (Ni-NTA resin) affinity column (M = marker). B–G. Reduced minus oxidized difference spectra of Rb. capsulatus BC1. Spectra were taken in 50 mM MOPS (pH 7.8, 20 % glycerol, 100mM NaCl, 1mM MgCl2, 0.01 % DM and 15 μg/ml PC). Figures B–G are taken in the α-β peak region. Samples were oxidized with ferricyanide and reduced with ascorbate and subsequently with dithionite. Black traces show dithionite-reduced minus ferricyanide-oxidized spectra, red lines show ascorbate-reduced minus ferricyanide-oxidized spectra. Panel B: WT; panel C: Y152Q; panel D: Y153A; panel E: Y153Q; panel F: Y153F; panel G: (Y154A, A181T, A200V) mutant.
Figure 3
Figure 3
A. SDS-page gel for wild-type R. capsulatus BC1, purified using a TALON (Ni-NTA resin) affinity column (M = marker). B–G. Reduced minus oxidized difference spectra of Rb. capsulatus BC1. Spectra were taken in 50 mM MOPS (pH 7.8, 20 % glycerol, 100mM NaCl, 1mM MgCl2, 0.01 % DM and 15 μg/ml PC). Figures B–G are taken in the α-β peak region. Samples were oxidized with ferricyanide and reduced with ascorbate and subsequently with dithionite. Black traces show dithionite-reduced minus ferricyanide-oxidized spectra, red lines show ascorbate-reduced minus ferricyanide-oxidized spectra. Panel B: WT; panel C: Y152Q; panel D: Y153A; panel E: Y153Q; panel F: Y153F; panel G: (Y154A, A181T, A200V) mutant.
Figure 4
Figure 4
Detailed structural view of the C1 heme and hinge region. Hinge region is shown in brown, Y-triad in cyan and C1 heme in pink. Y153 is packed closely to P184, which is adjacent to the sixth heme ligand M183. Distances between carbon atoms (in Å) are labeled in black.

Similar articles

Cited by

References

    1. Mather MW, Darrouzet E, Valkova-Valchanova M, Cooley JW, McIntosh MT, Daldal F, Vaidya AB. Uncovering the molecular mode of action of the antimalarial drug atovaquone using a bacterial system. J Biol Chem. 2005;280:27458– 27465. - PMC - PubMed
    1. Yeates CL, Batchelor JF, Capon EC, Cheesman NJ, Fry M, Hudson AT, Pudney M, Trimming H, Woolven J, Bueno JM, Chicarro J, Fernandez E, Fiandor JM, Gargallo-Viola D, Gomez de las Heras F, Herreros E, Leon ML. Synthesis and Structure–Activity Relationships of 4-Pyridones as Potential Antimalarials. J Med Chem. 2008;51:2845–2852. - PubMed
    1. Barlett DW, Clough JM, Godwin JR, Hall AA, Hamer M, Parr-Dobrzanski B. The strobilurin fungicides. Pest Manag Sci. 2002;58:649–662. - PubMed
    1. Jordan DB, Kranis KT, Picollelli MA, Schwartz RS, Sternberg JA, Sun KM. Famoxadone and oxazolidinones: potent inhibitors of cytochrome bc1. Biochem Soc Trans. 1999;27:577–580. - PubMed
    1. Zhu J, Egawa T, Yeh S, Yu L, Yu C. Simultaneous reduction of iron–sulfur protein and cytochrome bL during ubiquinol oxidation in cytochrome bc1 complex. Proc Natl Acad Sci U S A. 2007;104:4864–4869. - PMC - PubMed

Publication types

MeSH terms

LinkOut - more resources