. 2012 Feb 5;9(3):277-82.
doi: 10.1038/nmeth.1868.

Interspecies activity correlations reveal functional correspondence between monkey and human brain areas

Affiliations

Interspecies activity correlations reveal functional correspondence between monkey and human brain areas

Dante Mantini et al. Nat Methods. .

Abstract

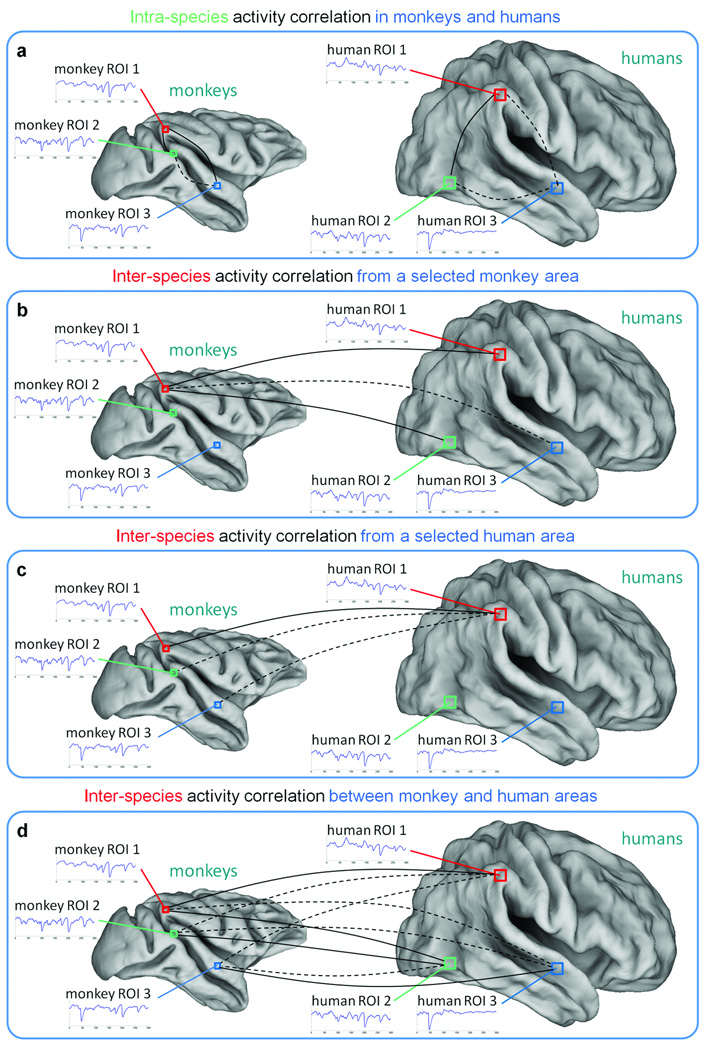
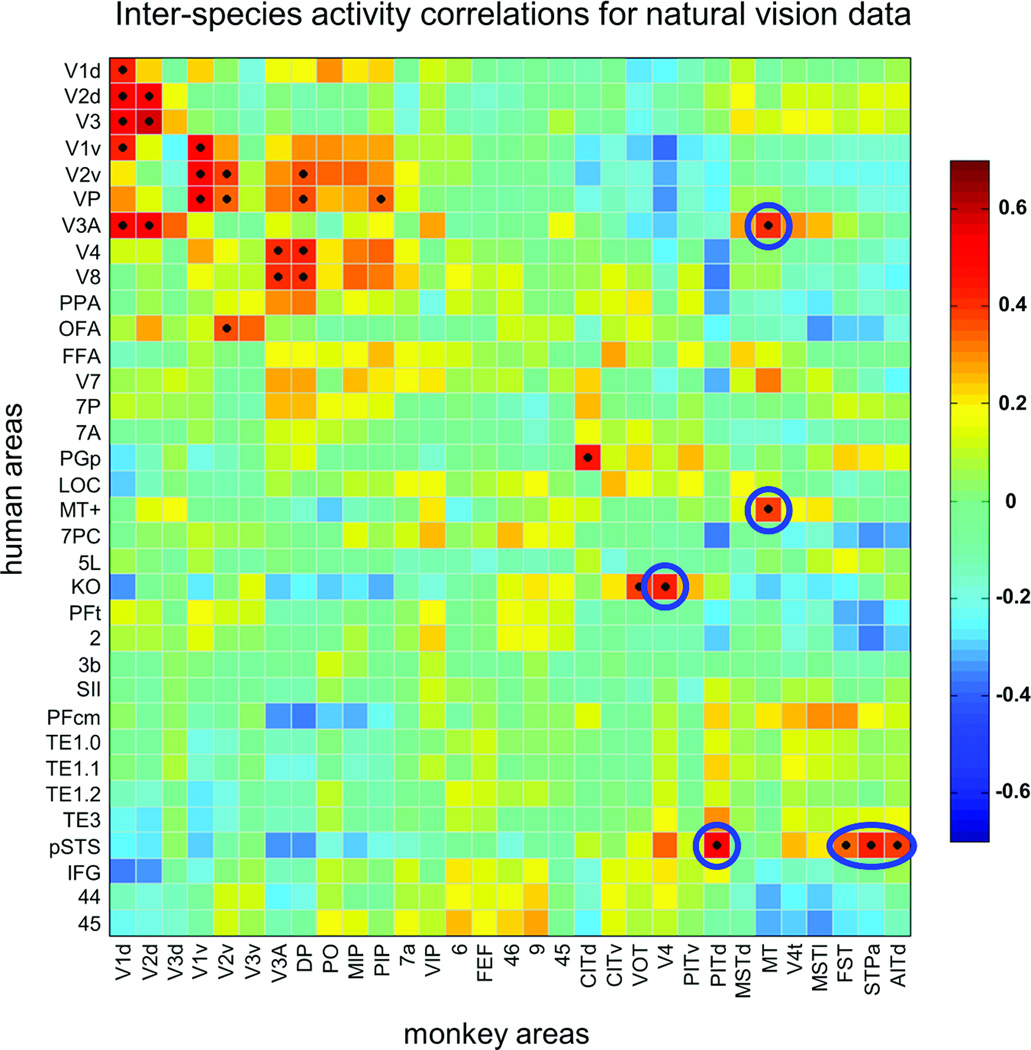
Evolution-driven functional changes in the primate brain are typically assessed by aligning monkey and human activation maps using cortical surface expansion models. These models use putative homologous areas as registration landmarks, assuming they are functionally correspondent. For cases in which functional changes have occurred in an area, this assumption prohibits to reveal whether other areas may have assumed lost functions. Here we describe a method to examine functional correspondences across species. Without making spatial assumptions, we assessed similarities in sensory-driven functional magnetic resonance imaging responses between monkey (Macaca mulatta) and human brain areas by temporal correlation. Using natural vision data, we revealed regions for which functional processing has shifted to topologically divergent locations during evolution. We conclude that substantial evolution-driven functional reorganizations have occurred, not always consistent with cortical expansion processes. This framework for evaluating changes in functional architecture is crucial to building more accurate evolutionary models.


Figures

Fig. 1
Fig. 1. Detection of activity correlations between monkeys and humans
Similarities in the fMRI time-courses across species are assessed by temporal correlation, which may be significant (continuous line) or not significant (dashed line). (a) Intra-species activity correlation is measured by comparing the time-course of a selected area with the voxel time-courses in the same brain. (b–c) Inter-species activity correlation is measured by comparing the time-courses of a monkey and human area respectively, with the voxel time-courses in the other species. (d) Inter-species activity correlations can be also computed between time-courses in multiple monkey and human brain areas. ROI: region of interest.
Fig. 2
Fig. 2. Inter-subject correlation of brain activity during natural vision
Spatial maps of correlated brain activity (FDR of q < 0.05) across participants of the same species. (a) Brain areas with significantly correlated responses across 24 human volunteers (human inter-subject correlation), plotted on a flattened cortex. (b) Brain areas with significantly correlated responses across 4 monkeys (monkey inter-subject correlation), plotted on a flattened cortex. Boundaries of identified areas are superimposed onto the cortex. The approximate location of parietal, auditory and frontal regions is indicated by green, purple and white dashed lines, respectively. AITd: dorsal anterior inferotemporal area; CITd: dorsal central inferotemporal area; CITv: ventral central inferotemporal area; DP: dorsal prelunate area; FEF: frontal eye fields; FFA: fusiform face area; FST: fundal superior temporal area; IFG: inferior frontal gyrus; KO: kinetic occipital region; LOC: lateral occipital complex; MIP: medial intraparietal area; MSTd: dorsal medial superior temporal area; MSTl: lateral medial superior temporal area; MT: middle temporal area; MT+: middle temporal complex; OFA: occipital face area; PIP: posterior intraparietal area; PITd: dorsal posterior inferotemporal area; PITv: ventral posterior inferotemporal area; PO: parieto-occipital area; PPA: parahippocampal place area; pSTS: posterior superior temporal sulcus; SII: secondary somatosensory area; STPa: anterior superior temporal polysensory area; V1d: visual area V1, dorsal subdivision; V1v: visual area V1, ventral subdivision; V2d: visual area V2, dorsal subdivision; V2v: visual area V2, ventral subdivision; V3d: visual area V3, dorsal subdivision; V3v: visual area V3, ventral subdivision; V4t: transitional visual area V4; VIP: ventral intraparietal area; VOT: ventral occipitotemporal area; VP: ventroposterior visual area.
Fig. 3
Fig. 3. Intra- and inter-species activity correlation from monkey areas PITd and CITd
Intra- and inter-species activity correlation maps (FDR of q < 0.001) from both left and right monkey (a) PITd and (b) CITd. The correlation maps are shown only for the same hemisphere in which the seed area is positioned. The borders of monkey areas MT, PITd, CITd are drawn over the monkey flat map. The same borders after monkey-to-human cortical surface expansion are drawn over the human flat map. aTOS: anterior transverse occipital sulcus; PCu: precuneus; pMTG: posterior middle temporal gyrus; pPITd: human posterior area PITd.
Fig. 4
Fig. 4. Intra- and inter-species activity correlation from monkey areas AIP and V3A
Intra- and inter-species activity correlation maps (FDR of q < 0.001) from functionally-defined monkey areas are illustrated. (a) Monkey and human areas showing activity correlated with that in monkey AIP. (b) Monkey and human areas showing activity correlated with that in monkey V3A. AIP: anterior intraparietal area; DIPSA: anterior dorsal intraparietal sulcus area.
Figure 5
Figure 5. Inter-species activity correlations between monkey and human areas
The ISAC matrix, calculated on 31 monkey and 34 human areas with consistent fMRI responses, is sorted so that areas with the strongest intra-species correlations are neighboring. Significant functional correspondences, defined on the basis of the Pearson’s correlation test (FDR of q < 0.001), are marked with a black dot. Inter-species correspondences that are commented in the text are marked with either circular or oval-shaped borders.

Similar articles

Cited by

References

    1. Tootell RB, Tsao D, Vanduffel W. Neuroimaging weighs in: humans meet macaques in "primate" visual cortex. J. Neurosci. 2003;23:3981–3989. - PMC - PubMed
    1. Nakahara K, Hayashi T, Konishi S, Miyashita Y. Functional MRI of macaque monkeys performing a cognitive set-shifting task. Science. 2002;295:1532–1536. - PubMed
    1. Vanduffel W, et al. Extracting 3D from motion: differences in human and monkey intraparietal cortex. Science. 2002;298:413–415. - PubMed
    1. Orban GA, Van Essen D, Vanduffel W. Comparative mapping of higher visual areas in monkeys and humans. Trends Cogn Sci. 2004;8:315–324. - PubMed
    1. Van Essen DC, Dierker DL. Surface-based and probabilistic atlases of primate cerebral cortex. Neuron. 2007;56:209–225. - PubMed

Publication types