. 2012 Feb 15;11(4):706-14.
doi: 10.4161/cc.11.4.19125. Epub 2012 Feb 15.

ApoA1: mimetic peptide reverses adipocyte dysfunction in vivo and in vitro via an increase in heme oxygenase (HO-1) and Wnt10b

Affiliations

ApoA1: mimetic peptide reverses adipocyte dysfunction in vivo and in vitro via an increase in heme oxygenase (HO-1) and Wnt10b

Luca Vanella et al. Cell Cycle. .

Abstract

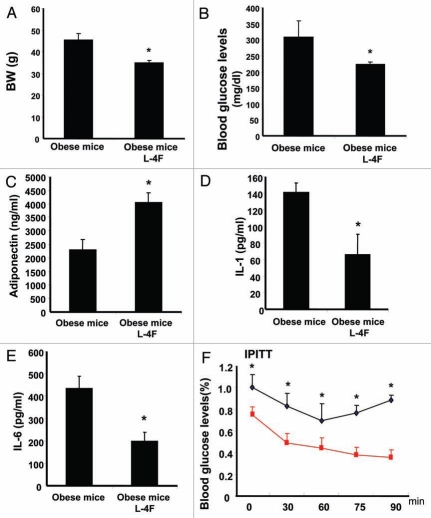
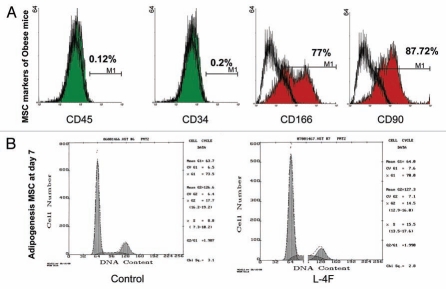
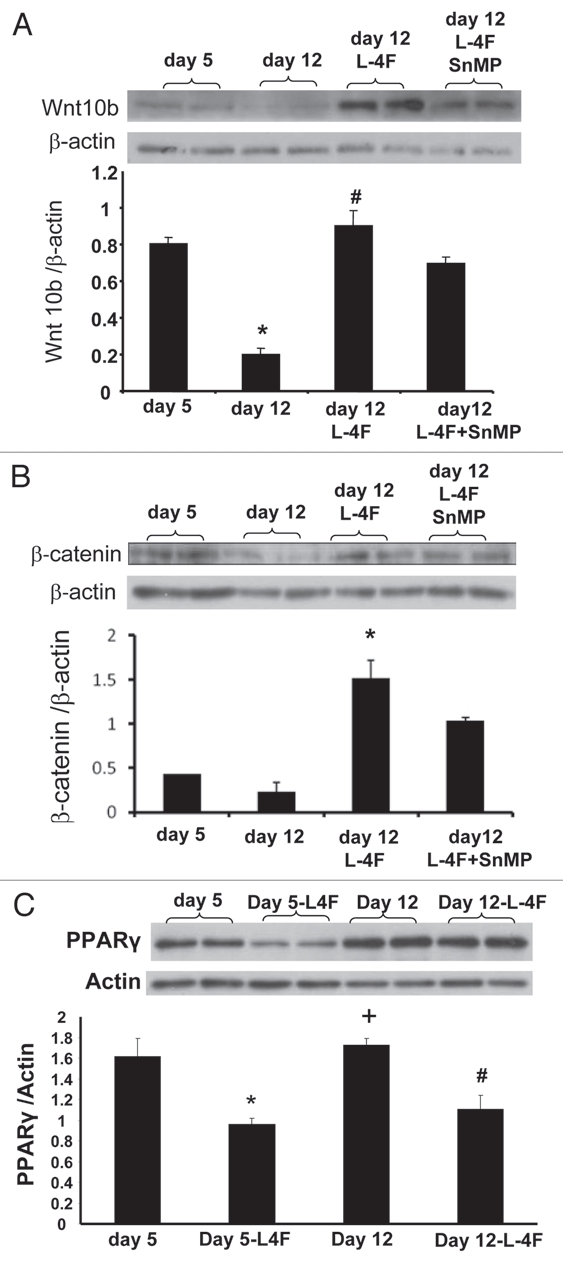
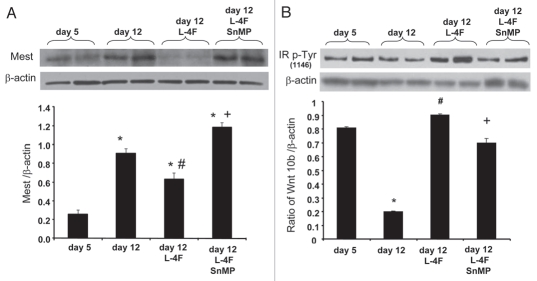
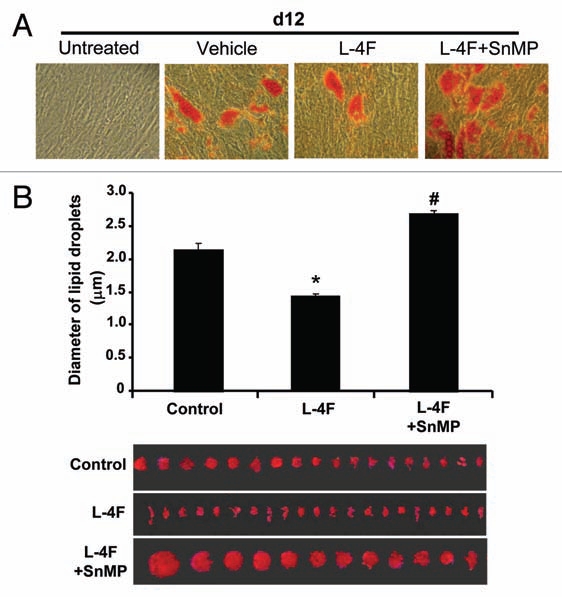
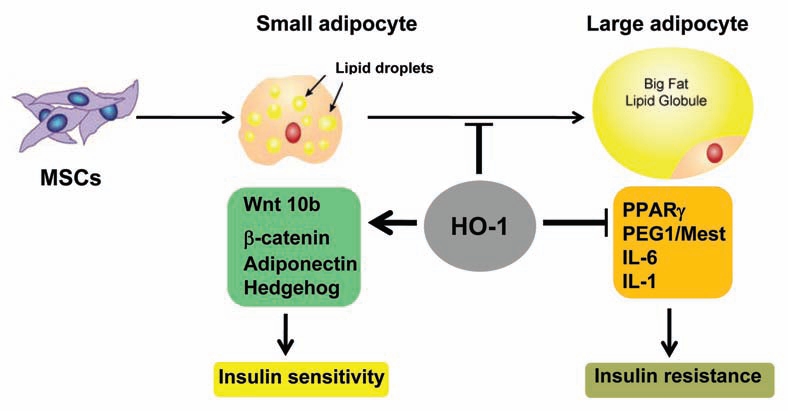
Insulin resistance is a risk factor in the development of type 2 diabetes and is a major cause of atherosclerosis. Reduction in heme oxygenase (HO-1) has been shown to exacerbate vascular dysfunction and insulin resistance in obese mice and involves a decrease in adiponectin levels. Adiponectin is released from mesenchymal stem cell (MSC)-derived adipocytes, its levels are decreased in type 2 diabetes. We hypothesized that the apoA1 mimetic peptide, L-4F, will target the expression of the HO-1-adiponectin axis and reverse adipocyte dysfunction both in vivo and in vitro. The administration of L-4F [2 mg/Kg/daily (i.p.) for 4-week to 8-week-old obese (ob) mice restored adipocyte function, increased adiponectin release (p < 0.05) and decreased the levels of IL-1 and IL-6 (p < 0.05)]. These perturbations were associated with an increase in insulin sensitivity (p < 0.01 vs. untreated ob mice) and decreased glucose levels (309 + 42 vs. 201 + 8 mg/d after L-4F treatment). Treatment of both mesenchymal stem cell (MSC)-derived adipocytes with L-4F (50 μg/ml) increased adiponectin (p < 0.05), decreased IL-1 and IL-6 (p < 0.05) levels and increased MSC-derived adipocyte cell numbers by 50% in S phase (p < 0.05). MSC-derived adipocytes treated with L-4F increased WNT10b and decreased Peg 1/Mest. Inhibition of HO activity reversed the decrease in the adipogenic response gene, Peg 1/Mest. An increase of HO-1 expression by L-4F increased insulin-receptor phosphorylation. These findings support the hypothesis that L-4F increases early adipocyte markers, HO-1-adiponectin, WNT10b and decreases Peg1/Mest, negative regulators of adipocyte differentiation.


Figures

Figure 1
Figure 1
Effect of L-4F on body weight, blood glucose levels, adiponectin, IL-1 and IL-6 in ob mice. (A–E) respectively. (A) Body weight is shown. (B) Fasting blood glucose levels (*p < 0.001). (C) Plasma adiponectin levels (*p < 0.05). (D) Plasma IL-1 levels (*p < 0.01). (E) Plasma IL-6 levels (*p < 0.01). (F) Blood glucose levels after insulin administration (*p < 0.05). The results are mean ± SE, n = 6 in each group.
Figure 2
Figure 2
Determination of MSCs phenotype and cell cycle measurement. (A) Membrane antigen expressions of CD45, CD4, CD90, CD166 and on hMSCs were analyzed by FACS analysis. As positive markers CD90 (Thy-1) and CD166 (ALCAM, activated leukocyte cell adhesion molecule) were 87.72% and 77% respectively. As negative markers, CD45 (common lymphocytes antigen) and CD34, an hematopoietic stem cell marker, were shown to be expressed in less than 1% of cells. (B) Effect on cell cycle and Growth. Cells were treated Vinblastin to arrest mitosis then we measured DNA distribution by DAPI staining. Cell cycle analysis revealed that 15.5% of MSCs were in the S phase when the cells were cultured in L-4F.
Figure 3
Figure 3
Effect of L-4F on HO-1 expression and activity. (A) Western blot of HO-1 proteins in MSC-derived adipocytes treated with L-4F and SnMP. Representative immunoblots are shown (n = 4). MSCs were cultured in adipogenic differentiation media and L-4F was added every 3 days. Quantitative densitometry evaluation of HO-1 and actin proteins ratio was determined. Data are expressed as means ± SD (*p < 0.05 vs. day 12). (B) Effect of L-4F on HO activity as measured by bilirubin generation. Bilirubin formed in cellular homogenates in the presence of heme and NADPH was measured (*p < 0.001 vs. day 12). Combination of L-4F with SnMP reduces HO activity (#p < 0.001 vs. day 12 + L-4F).
Figure 4
Figure 4
Effect of L-4F on Wnt10b, β-catenin and PPARγ levels. Western blot of Wnt10b, β-catenin, PPARγ and actin proteins in MSC-derived adipocytes treated with L-4F alone or in combination with SnMP. Representative immunoblots are shown (n = 4). Quantitative densitometry evaluation of Wnt10b β-catenin and actin proteins ratio was determined. Data are expressed as means ± SD (*p < 0.05 vs. day 5, #p < 0.05 vs. day 12, +p < 0.05 vs. day5 + L4F).
Figure 5
Figure 5
Effect of L-4F on Mest and IRP-Tyr1146. Western blot of Mest, IRP-Tyr1146 and actin proteins in MSC-derived adipocytes treated with L-4F alone or in combination with SnMP. Representative immunoblots are shown (n = 4). Quantitative densitometry evaluation of Mest, IRP-Tyr1146 and actin proteins ratio was determined. Data are expressed as means ± SD (*p < 0.05 vs. day 5, #p < 0.05 vs. day 12, +p < 0.05 vs. day 5 + L4F).
Figure 6
Figure 6
Effect of L-4F on adipogenesis and adipocyte size. (A) Scan of lipid size of a representative experiment. Adipogenesis was measured as the relative absorbance of Oil Red O at day 12 after inducing adipogenesis as described in Materials and Methods. (B) Measurement of diameter of lipid droplet size. Results are mean ± SD (*p < 0.05 vs. L-4F, #p < 0.05 vs. L-4F + SnMP).
Figure 7
Figure 7
Hypertrophy adipocytes are associated with dysfunctional adipogenesis with resultant contributions toward metabolic imbalance. The proposed mechanism demonstrate that an upregulation of HO-1 is directly involved in the regulation of adipogenic markers by increasing Wnt10b protein levels, decreasing Peg/Mest and improving insulin sensitivity.

Similar articles

Cited by

References

    1. Schulz E, Dopheide J, Schuhmacher S, Thomas SR, Chen K, Daiber A, et al. Suppression of the JNK pathway by induction of a metabolic stress response prevents vascular injury and dysfunction. Circulation. 2008;118:1347–1357. - PMC - PubMed
    1. Steinberg HO, Chaker H, Leaming R, Johnson A, Brechtel G, Baron AD. Obesity/insulin resistance is associated with endothelial dysfunction. Implications for the syndrome of insulin resistance. J Clin Invest. 1996;97:2601–2610. doi: 10.1172/JCI118709.. - DOI - PMC - PubMed
    1. Sivitz WI, Wayson SM, Bayless ML, Sinkey CA, Haynes WG. Obesity impairs vascular relaxation in human subjects: hyperglycemia exaggerates adrenergic vasoconstriction arterial dysfunction in obesity and diabetes. J Diabetes Complications. 2007;21:149–157. doi: 10.1016/j.jdiacomp.2005.12.003. - DOI - PubMed
    1. Hall JE. The kidney, hypertension and obesity. Hypertension. 2003;41:625–633. doi: 10.1161/01.HYP.0000052314.95497.78. - DOI - PubMed
    1. Sodhi K, Inoue K, Gotlinger KH, Canestraro M, Vanella L, Kim DH, et al. Epoxyeicosatrienoic acid agonist rescues the metabolic syndrome phenotype of HO-2-null mice. J Pharmacol Exp Ther. 2009;331:906–916. doi: 10.1124/jpet.109.157545. - DOI - PMC - PubMed

Publication types

LinkOut - more resources