. 2012 Apr;78(8):2660-8.
doi: 10.1128/AEM.07901-11. Epub 2012 Feb 3.

Rerouting carbon flux to enhance photosynthetic productivity

Affiliations

Rerouting carbon flux to enhance photosynthetic productivity

Daniel C Ducat et al. Appl Environ Microbiol. 2012 Apr.

Abstract

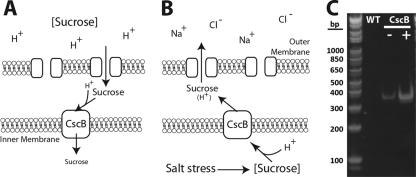
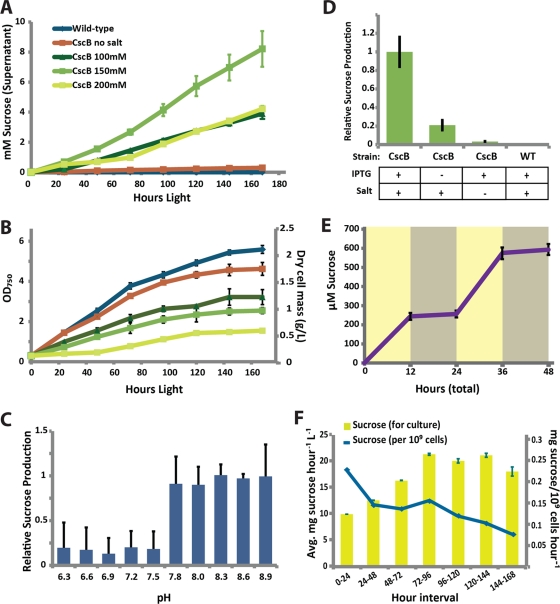
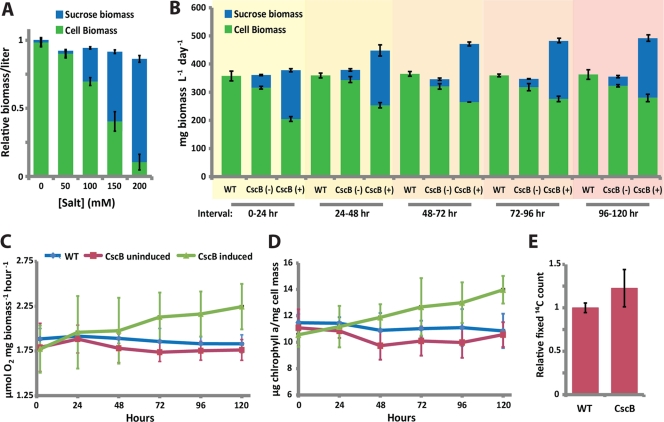
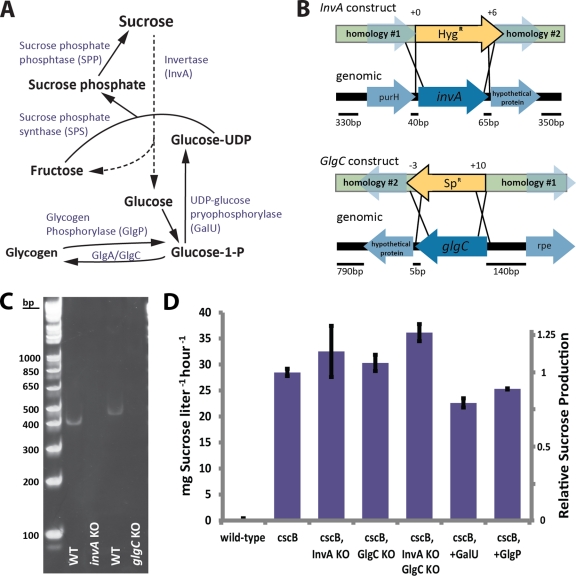
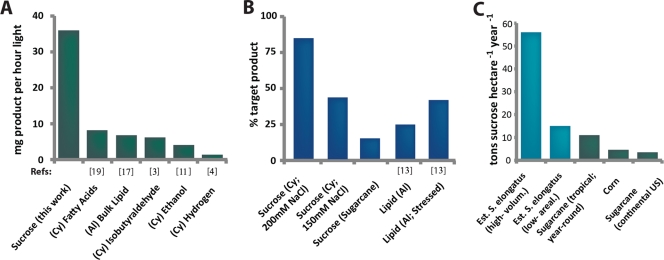
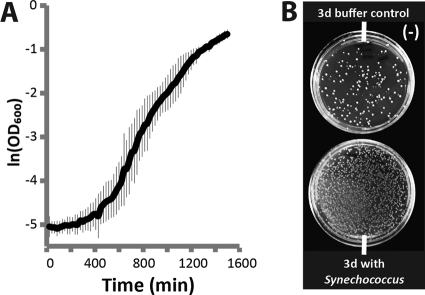
The bioindustrial production of fuels, chemicals, and therapeutics typically relies upon carbohydrate inputs derived from agricultural plants, resulting in the entanglement of food and chemical commodity markets. We demonstrate the efficient production of sucrose from a cyanobacterial species, Synechococcus elongatus, heterologously expressing a symporter of protons and sucrose (cscB). cscB-expressing cyanobacteria export sucrose irreversibly to concentrations of >10 mM without culture toxicity. Moreover, sucrose-exporting cyanobacteria exhibit increased biomass production rates relative to wild-type strains, accompanied by enhanced photosystem II activity, carbon fixation, and chlorophyll content. The genetic modification of sucrose biosynthesis pathways to minimize competing glucose- or sucrose-consuming reactions can further improve sucrose production, allowing the export of sucrose at rates of up to 36.1 mg liter(-1) h illumination(-1). This rate of production exceeds that of previous reports of targeted, photobiological production from microbes. Engineered S. elongatus produces sucrose in sufficient quantities (up to ∼80% of total biomass) such that it may be a viable alternative to sugar synthesis from terrestrial plants, including sugarcane.


Figures

Fig 1
Fig 1
Schematic of sucrose permease activity and expression in S. elongatus. (A) Typically, CscB supports sucrose import from relatively acidic environments through proton symport. (B) S. elongatus naturally basifies its environment, leading to a reversed proton gradient and CscB directionality. Under hyperosmotic conditions, S. elongatus produces cytosolic sucrose for osmotic balance, and it can be exported through the action of CscB. (C) Quantitative reverse transcriptase PCR of the cscB transcript in wild-type (WT) and constructed strains with (+) or without (−) IPTG induction.
Fig 2
Fig 2
CscB-dependent export of sucrose in growing cyanobacterial cultures. (A) Concentration of sucrose in the supernatant of S. elongatus cultures with or without cscB expression when grown with 0 to 200 mM NaCl for 1 week in constant light. (B) Cell growth of cultures shown in panel A as measured by optical density at 750 nm (OD750). Sucrose export is dependent upon culture pH (C) and both IPTG and salt induction (D). (E) Sucrose produced by cscB-expressing S. elongatus under alternating periods of light (yellow) and dark (gray). (F) Daily total (yellow bars) and per-cell (blue line) rate of sucrose production for 150 mM NaCl-induced cultures shown in panel A. Data are from representative experiments where error bars represent standard deviations from ≥3 replicates.
Fig 3
Fig 3
Increased biomass production and photosynthetic activity in S. elongatus exporting sucrose. (A) Normalized sucrose and cellular biomass fixed in the first 24 h following transfer to the indicated level of salt. (B) Measurement of cyanobacterially produced cellular biomass (dry weight; green) and sucrose biomass (blue) produced by wild-type (WT), uninduced (−), and cscB-expressing (+) strains after 24 h in cultures acclimatized to 150 mM NaCl. The time of 0 h represents the time of initial induction with 1 mM IPTG and where cultures are backdiluted to constant density (114 ± 7 mg cell mass liter−1) at the start of each 24-h cycle. Oxygen evolution rates (C) and chlorophyll a contents (D) of wild-type, uninduced, and induced cyanobacterial cultures for cells treated as described for panel B. (E) Relative carbon fixation rates of WT and cscB-expressing cells as determined by the incorporation of radiolabeled [14C]bicarbonate, where cscB-expressing cultures were induced for at least 4 days and backdiluted to constant density as described for panel B. Data for panels A and B are from a representative experiment where similar results were obtained for at least 5 independent replicates. Data for panels C to E represent averages from ≥4 independent experiments. Error bars indicate standard deviations from ≥3 replicates.
Fig 4
Fig 4
Engineering of glucose metabolism for improved sucrose secretion. (A) Schematic of glucose and sucrose metabolism in S. elongatus. (B) Schematic of constructs designed for site-directed elimination of target genes (invA and glgC) at the depicted loci in S. elongatus. Resistance cassettes were flanked by DNA homologous to sequences neighboring target genes to allow for the selection of strains with the loss of target genes following homologous recombination. Any additional/fewer base pairs recombined relative to the start or stop codons of the target gene are indicated above the construct depiction. (C) Representative reverse transcriptase PCRs from the wild-type strain or the indicated knockout strains using primers targeting invA or glgC transcript (expected size of 410 and 470 bp, respectively). (D) Sucrose production rates for strains of S. elongatus with modifications in the indicated sucrose/glucose metabolic genes by knockout (KO) or gene expression (+).
Fig 5
Fig 5
Comparison of cyanobacterial sucrose productivity to alternative photobiological productivities. (A) Summary of photobiological product formation rates from existing literature on cyanobacteria (Cy) and algae (Al). (B) Sucrose productivity in cscB-expressing S. elongatus compares favorably to the percentage of total biomass directed to named metabolites for example species. (C) Estimated potential of sucrose production from scaled cultures of cscB-expressing S. elongatus using volumetric (high) and areal (low) productivities obtained under laboratory environmental conditions (blue; see Materials and Methods for details). Known carbohydrate productivities for traditional terrestrial crops are plotted for comparison (green) (34, 39; also http://www.nass.usda.gov/). The sources of other data are indicated beneath the bars (3, 4, 11, 13, 17, 19).
Fig 6
Fig 6
Support of heterotrophic metabolism from cyanobacterially produced sucrose. (A) Growth curve of S. cerevisiae incubated alone in BG11[N2] medium supplemented with 2% sucrose. (B) Yeast viability following 3 days (3d) of growth in BG11[N2] alone (top) or cocultured with sucrose-exporting cyanobacteria (bottom).

References

    1. Abramson J, Iwata S, Kaback HR. 2004. Lactose permease as a paradigm for membrane transport proteins (review). Mol. Membr. Biol. 21:227–236 - PubMed
    1. Anonymous 2011, posting date World food situation. Food and Agriculture Organization of the United Nations http://www.fao.org/worldfoodsituation/wfs-home/en/
    1. Atsumi S, Higashide W, Liao JC. 2009. Direct photosynthetic recycling of carbon dioxide to isobutyraldehyde. Nat. Biotechnol. 27:1177–1180 - PubMed
    1. Bandyopadhyay A, Stockel J, Min H, Sherman LA, Pakrasi HB. 2010. High rates of photobiological H2 production by a cyanobacterium under aerobic conditions. Nat. Commun. 1:139. - PubMed
    1. Barford D, Hu SH, Johnson LN. 1991. Structural mechanism for glycogen phosphorylase control by phosphorylation and AMP. J. Mol. Biol. 218:233–260 - PubMed

Publication types