

Abrupt temporal fluctuations in the chicken fecal microbiota are explained by its gastrointestinal origin
- PMID: 22307311
- PMCID: PMC3318845
- DOI: 10.1128/AEM.05391-11
Abrupt temporal fluctuations in the chicken fecal microbiota are explained by its gastrointestinal origin
Abstract
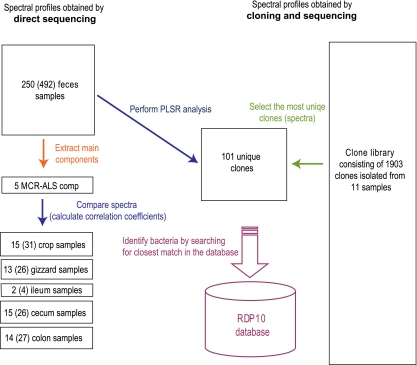
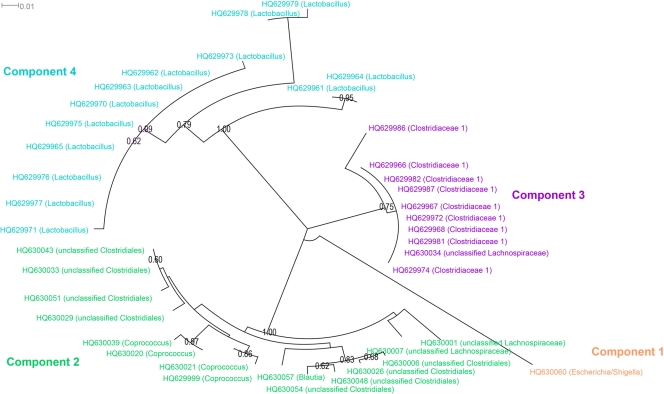
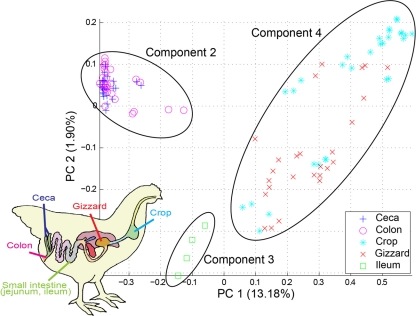
One of the main challenges in understanding the composition of fecal microbiota is that it can consist of microbial mixtures originating from different gastrointestinal (GI) segments. Here, we addressed this challenge for broiler chicken feces using a direct 16S rRNA gene-sequencing approach combined with multivariate statistical analyses. Broiler feces were chosen because of easy sampling and the importance for pathogen transmission to the human food chain. Feces were sampled daily for 16 days from chickens with and without a feed structure-induced stimulation of the gastric barrier function. Overall, we found four dominant microbial phylogroups in the feces. Two of the phylogroups were related to clostridia, one to lactobacilli, and one to Escherichia/Shigella. The relative composition of these phylogroups showed apparent stochastic temporal fluctuations in feces. Analyses of dissected chickens at the end of the experiment, however, showed that the two clostridial phylogroups were correlated to the microbiota in the cecum/colon and the small intestine, while the upper gut (crop and gizzard) microbiota was correlated to the lactobacillus phylogroup. In addition, chickens with a stimulated gizzard also showed less of the proximate GI dominating bacterial group in the feces, supporting the importance of the gastric barrier function. In conclusion, our results suggest that GI origin is a main determinant for the chicken fecal microbiota composition. This knowledge will be important for future understanding of factors affecting shedding of both harmful and beneficial gastrointestinal bacteria through feces.
Figures
References
-
- Bjerrum L, Pedersen K, Engberg RM. 2005. The influence of whole wheat feeding on Salmonella infection and gut flora composition in broilers. Avian Dis. 49:9–15 - PubMed
-
- Codling C, O'Mahony L, Shanahan F, Quigley E, Marchesi J. 2010. A molecular analysis of fecal and mucosal bacterial communities in irritable bowel syndrome. Dig. Dis. Sci. 55:392–397 - PubMed
-
- Denstadli V, et al. 2010. Effects of structure and xylanase treatment of brewers' spent grain on performance and nutrient availability in broiler chickens. Br. Poult. Sci. 51:419–426 - PubMed
Publication types
MeSH terms
Substances
Associated data
- Actions
- Actions
- Actions
- Actions
- Actions
- Actions
- Actions
- Actions
- Actions
- Actions
- Actions
- Actions
- Actions
- Actions
- Actions
- Actions
- Actions
- Actions
- Actions
- Actions
- Actions
- Actions
- Actions
- Actions
- Actions
- Actions
- Actions
- Actions
- Actions
- Actions
- Actions
- Actions
- Actions
- Actions
- Actions
- Actions
- Actions
- Actions
- Actions
- Actions
- Actions
- Actions
- Actions
- Actions
- Actions
- Actions
- Actions
- Actions
- Actions
- Actions
- Actions
- Actions
- Actions
- Actions
- Actions
- Actions
- Actions
- Actions
- Actions
- Actions
- Actions
- Actions
- Actions
- Actions
- Actions
- Actions
- Actions
- Actions
- Actions
- Actions
- Actions
- Actions
- Actions
- Actions
- Actions
- Actions
- Actions
- Actions
- Actions
- Actions
- Actions
- Actions
- Actions
- Actions
- Actions
- Actions
- Actions
- Actions
- Actions
- Actions
- Actions
- Actions
- Actions
- Actions
- Actions
- Actions
- Actions
- Actions
- Actions
- Actions
- Actions
LinkOut - more resources
Full Text Sources
