. 2012 Jan 31;109(5):1661-6.
doi: 10.1073/pnas.1113166109. Epub 2012 Jan 17.

Mitochondrial dysfunction and Purkinje cell loss in autosomal recessive spastic ataxia of Charlevoix-Saguenay (ARSACS)

Affiliations

Mitochondrial dysfunction and Purkinje cell loss in autosomal recessive spastic ataxia of Charlevoix-Saguenay (ARSACS)

Martine Girard et al. Proc Natl Acad Sci U S A. .

Abstract

Autosomal recessive spastic ataxia of Charlevoix-Saguenay (ARSACS) is a childhood-onset neurological disease resulting from mutations in the SACS gene encoding sacsin, a 4,579-aa protein of unknown function. Originally identified as a founder disease in Québec, ARSACS is now recognized worldwide. Prominent features include pyramidal spasticity and cerebellar ataxia, but the underlying pathology and pathophysiological mechanisms are unknown. We have generated an animal model for ARSACS, sacsin knockout mice, that display age-dependent neurodegeneration of cerebellar Purkinje cells. To explore the pathophysiological basis for this observation, we examined the cell biological properties of sacsin. We show that sacsin localizes to mitochondria in non-neuronal cells and primary neurons and that it interacts with dynamin-related protein 1, which participates in mitochondrial fission. Fibroblasts from ARSACS patients show a hyperfused mitochondrial network, consistent with defects in mitochondrial fission. Sacsin knockdown leads to an overly interconnected and functionally impaired mitochondrial network, and mitochondria accumulate in the soma and proximal dendrites of sacsin knockdown neurons. Disruption of mitochondrial transport into dendrites has been shown to lead to abnormal dendritic morphology, and we observe striking alterations in the organization of dendritic fields in the cerebellum of knockout mice that precedes Purkinje cell death. Our data identifies mitochondrial dysfunction/mislocalization as the likely cellular basis for ARSACS and indicates a role for sacsin in regulation of mitochondrial dynamics.


Conflict of interest statement

The authors declare no conflict of interest.

Figures

Fig. 1.
Fig. 1.
Sacsin KO mice display an age-dependent loss of cerebellar Purkinje cells. (A) Immunohistochemical sections of cerebellum from 120-d-old sacsin KO mice (SACS −/−) and wild-type littermates (SACS+/+) stained with antibody against calbindin d-28K (dark-gray) to highlight Purkinje cells. Arrows point to Purkinje cell bodies or regions in which Purkinje cells are absent. GCL, granule cell layer; ML, molecular layer. (B and C) Cell counts revealing the number of Purkinje cells in cerebellum from 120-d-old (B) or 200-d-old (C) sacsin KO mice (SACS−/−) and wild-type (SACS+/+) littermates. Data for B and C are means ± SEM. Significance was assessed by using an unpaired Student's t test (P < 0.001). (Scale bar: 50 μm.)
Fig. 2.
Fig. 2.
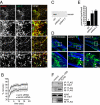
Sacsin localizes to mitochondria and regulates mitochondrial morphology. (A) Immunofluorescence panels of cultured hippocampal neurons double-labeled with rabbit antibody against sacsin and mouse monoclonal antibody against cytochrome C (cyto C). Images in Ai and Aii are 10× and 4× zooms, respectively, of the indicated areas from A Top. Images in Aiii are 2.5× zooms from the indicated area in Aii. N, nucleus. Double arrows, arrows, and arrowheads indicate sacsin/cytochrome C colocalization in the soma, dendrites, and axons, respectively. (B) SH-SY5Y cells treated with scrambled (scrm) siRNA or siRNA targeting sacsin were transfected with pAcGFP1-Mito, and defined 2 × 2 μm regions of interest were bleached by using a 488-nm laser line. Recovery was monitored over 20 cycles of imaging with a 1-s interval. Points represent mean ± SEM of FRAP measurements from 32 cells from two independent experiments. (C and D) Control fibroblasts and fibroblasts from two ARSACS patients were prepared for Western blot with polyclonal antibody against sacsin (C), or cells were fixed and processed for immunofluorescence with antibody against TOM20 (green) to reveal mitochondria and with phalloidin Alex647 to stain actin filaments, outlining the cells (D). The areas boxed in D Upper are indicated in a 4× magnification in D Lower. Arrows indicated balloon-like or bulbed mitochondria, characteristic of a hyperfused phenotype (30, 31, 33). (E) Minimally 15 fields (containing from one to five cells) from each cell type from each of three independent experiments were coded and counted blind and independently by two individuals. The combined assessment of the hyperfused status is presented as a mean and SD. (F) SH-SY5Y cells were mock-transfected (control) or were transfected with a FLAG-tagged construct encoding residues 1–1368 of sacsin. Immunoprecipitation (IP) was performed with anti-FLAG antibody, and immunoblots (IB) were performed with anti-FLAG or anti-Drp1 antibodies as indicated. The inputs of FLAG-sacsin and endogenous Drp1 are indicated. (Scale bars: A Top, 20 μm; Ai, 2 μm; Aii, 5 μm; Aiii, 2 μm; D Upper, 10 μm; D Lower, 2.5 μm.)
Fig. 3.
Fig. 3.
Sacsin KO impairs mitochondrial function. (A) SH-SY5Y cells were treated with control, scrambled (scrm) siRNA, or siRNA targeting sacsin and were then incubated with TMRM. Maximum intensity projections were generated from Z-stacks, and TMRM fluorescent intensities in individual cells were quantified. Bars represent mean ± SEM. Fluorescence was quantified in 45 cells from three independent experiments. Statistical significance was assessed by using a two-tailed independent t test. *P < 0.05. (B) SH-SY5Y cells treated as in A were incubated with 20 μM CCCP for 2 h before washout. ∆ψm-sensitive MitoTracker-Red was included in the media at 250 μM. Cells were fixed at 5-min intervals after CCCP washout and were imaged. Points represent the mean number of MitoTracker-positive transfected cells ± SEM. Cells were counted blind to experimental status in five randomly selected fields (each containing ≈30 transfected cells) from each of three independent experiments. Statistical significance was assessed by using a two-tailed independent Student's t test, *P < 0.05. (C) In mature cerebellar slice cultures (DIV14+), KO animals (SACS −/−) show a significant decrease in mitochondrial membrane potential compared with wild-type littermates (SACS+/+) as indicated by a decrease in the red/green fluorescence ratio of JC-1, a cationic dye that exhibits green emission (peak of 525 nm) in weakly polarized mitochondria that shifts to 590 nm (red) in more strongly depolarized mitochondria.
Fig. 4.
Fig. 4.
Sacsin loss of function alters the distribution of mitochondria in neurons. (A) Western blots (using antibodies against the indicated proteins) of lysates from cultured hippocampal neurons transduced with lentivirus encoding a control shRNAmiR (Q) or one of two different shRNAmiRs targeting sacsin (6034, 14181). The molecular mass of the proteins is indicated on the left. (B) Immunofluorescence panels of cultured hippocampal neurons (DIV14) double-labeled with chicken polyclonal antibody against MAP2 (blue) and mouse monoclonal antibody against cytochrome C (red). At DIV4, the neurons were transduced with lentivirus encoding a control shRNAmiR (Q) or one of two different shRNAmiRs targeting sacsin (6034, 14181). Arrows indicate mitochondria accumulating in proximal dendrites. (Scale bar: 40 μm.)
Fig. 5.
Fig. 5.
Sacsin KO alters dendritic morphology. (A) Immunofluorescence panels of sections from cerebellum of 120-d-old sacsin KO mice (SACS −/−) and control littermates (SACS+/+) stained with antibody against calbindin to reveal Purkinje cells. (B) Immunofluorescence panels of cerebellar slice cultures from sacsin KO mice (SACS−/−) and control littermates (SACS+/+) stained with antibody against calbindin to reveal Purkinje cells. (C) Quantification of images as in B reveals that the distribution of proximal dendrite diameter is shifted to larger diameters in SACS −/− neurons. The mean proximal dendrite diameter of SACS−/− Purkinje neurons is significantly larger than those from SACS+/+ littermates (5.58 ± 1.86 μm vs. 3.25 ± 1.06 μm; P < 0,001; two-tailed independent Student's t test). (Scale bars: 50 μm.)

References

    1. Bouchard JP, Barbeau A, Bouchard R, Bouchard RW. Autosomal recessive spastic ataxia of Charlevoix-Saguenay. Can J Neurol Sci. 1978;5:61–69. - PubMed
    1. Bouchard JP. Recessive spastic ataxia of Charlevoix-Saguenay. In: de Jong JMBV, editor. Hereditary Neuropathies and Spinocerebellar Atrophies Handbook of Clinical Neurology. Amsterdam: Elsevier; 1991. pp. 451–459.
    1. Dupré N, Bouchard JP, Brais B, Rouleau GA. Hereditary ataxia, spastic paraparesis and neuropathy in the French-Canadian population. Can J Neurol Sci. 2006;33:149–157. - PubMed
    1. Martin MH, Bouchard JP, Sylvain M, St-Onge O, Truchon S. Autosomal recessive spastic ataxia of Charlevoix-Saguenay: A report of MR imaging in 5 patients. AJNR Am J Neuroradiol. 2007;28:1606–1608. - PMC - PubMed
    1. Bouhlal Y, Amouri R, El Euch-Fayeche G, Hentati F. Autosomal recessive spastic ataxia of Charlevoix-Saguenay: An overview. Parkinsonism Relat Disord. 2011;17:418–422. - PubMed

Publication types

Supplementary concepts

LinkOut - more resources