

Spatiotemporal dynamics of neocortical excitation and inhibition during human sleep
- PMID: 22307639
- PMCID: PMC3277175
- DOI: 10.1073/pnas.1109895109
Spatiotemporal dynamics of neocortical excitation and inhibition during human sleep
Abstract
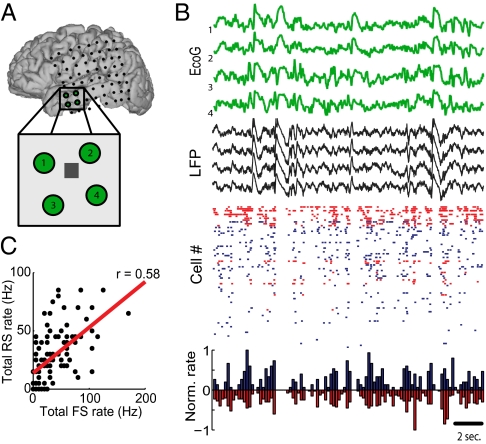
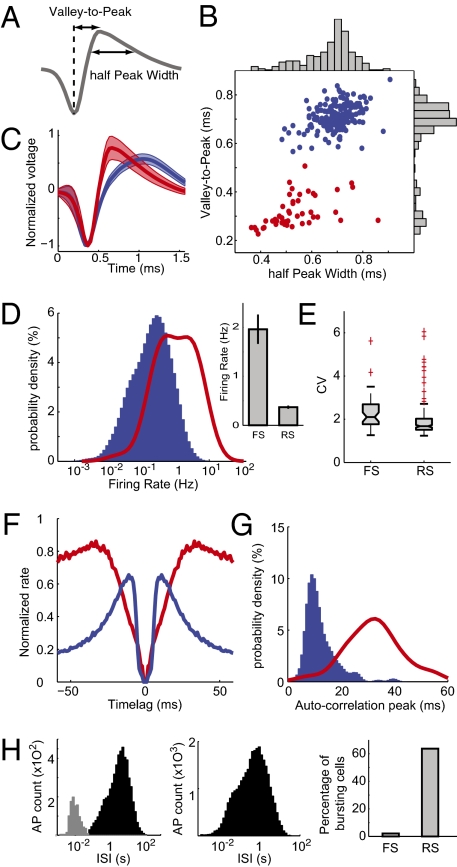
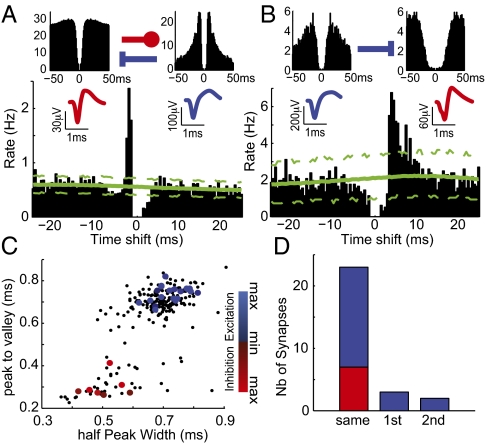
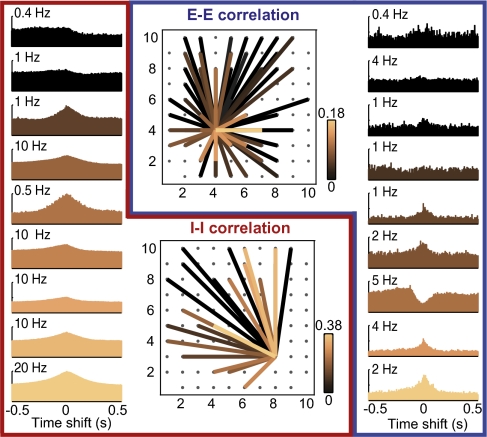
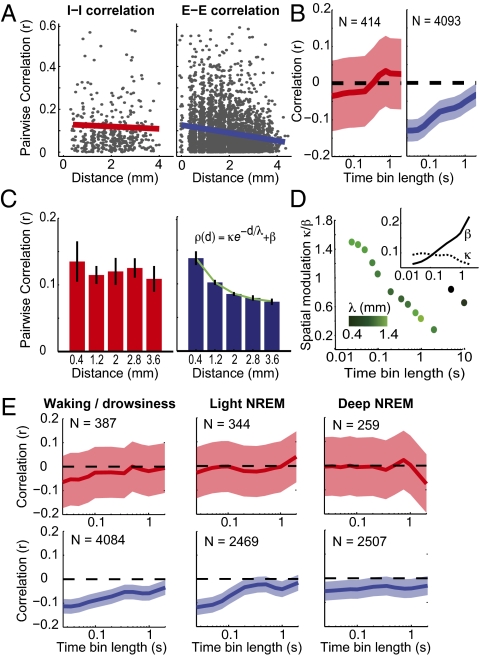
Intracranial recording is an important diagnostic method routinely used in a number of neurological monitoring scenarios. In recent years, advancements in such recordings have been extended to include unit activity of an ensemble of neurons. However, a detailed functional characterization of excitatory and inhibitory cells has not been attempted in human neocortex, particularly during the sleep state. Here, we report that such feature discrimination is possible from high-density recordings in the neocortex by using 2D multielectrode arrays. Successful separation of regular-spiking neurons (or bursting cells) from fast-spiking cells resulted in well-defined clusters that each showed unique intrinsic firing properties. The high density of the array, which allowed recording from a large number of cells (up to 90), helped us to identify apparent monosynaptic connections, confirming the excitatory and inhibitory nature of regular-spiking and fast-spiking cells, thus categorized as putative pyramidal cells and interneurons, respectively. Finally, we investigated the dynamics of correlations within each class. A marked exponential decay with distance was observed in the case of excitatory but not for inhibitory cells. Although the amplitude of that decline depended on the timescale at which the correlations were computed, the spatial constant did not. Furthermore, this spatial constant is compatible with the typical size of human columnar organization. These findings provide a detailed characterization of neuronal activity, functional connectivity at the microcircuit level, and the interplay of excitation and inhibition in the human neocortex.
Conflict of interest statement
The authors declare no conflict of interest.
Figures
Similar articles
-
Focal synchronization of ripples (80-200 Hz) in neocortex and their neuronal correlates.J Neurophysiol. 2001 Oct;86(4):1884-98. doi: 10.1152/jn.2001.86.4.1884. J Neurophysiol. 2001. PMID: 11600648
-
Specificity of synaptic connectivity between layer 1 inhibitory interneurons and layer 2/3 pyramidal neurons in the rat neocortex.Cereb Cortex. 2011 Aug;21(8):1818-26. doi: 10.1093/cercor/bhq257. Epub 2011 Jan 10. Cereb Cortex. 2011. PMID: 21220765 Free PMC article.
-
Innervation of interneurons immunoreactive for VIP by intrinsically bursting pyramidal cells and fast-spiking interneurons in infragranular layers of juvenile rat neocortex.Eur J Neurosci. 2002 Jul;16(1):11-20. doi: 10.1046/j.1460-9568.2002.02048.x. Eur J Neurosci. 2002. PMID: 12153527
-
Does inhibition balance excitation in neocortex?Prog Biophys Mol Biol. 2005 Jan;87(1):109-43. doi: 10.1016/j.pbiomolbio.2004.06.008. Prog Biophys Mol Biol. 2005. PMID: 15471593 Review.
-
Intrinsic firing patterns of diverse neocortical neurons.Trends Neurosci. 1990 Mar;13(3):99-104. doi: 10.1016/0166-2236(90)90185-d. Trends Neurosci. 1990. PMID: 1691879 Review.
Cited by
-
A 3D atlas of functional human brain energetic connectome based on neuropil distribution.Cereb Cortex. 2023 Mar 21;33(7):3996-4012. doi: 10.1093/cercor/bhac322. Cereb Cortex. 2023. PMID: 36104858 Free PMC article.
-
Regional healthy brain activity, glioma occurrence and symptomatology.Brain. 2022 Oct 21;145(10):3654-3665. doi: 10.1093/brain/awac180. Brain. 2022. PMID: 36130310 Free PMC article.
-
A Thalamocortical Neural Mass Model of the EEG during NREM Sleep and Its Response to Auditory Stimulation.PLoS Comput Biol. 2016 Sep 1;12(9):e1005022. doi: 10.1371/journal.pcbi.1005022. eCollection 2016 Sep. PLoS Comput Biol. 2016. PMID: 27584827 Free PMC article.
-
A comprehensive neural simulation of slow-wave sleep and highly responsive wakefulness dynamics.Front Comput Neurosci. 2023 Jan 13;16:1058957. doi: 10.3389/fncom.2022.1058957. eCollection 2022. Front Comput Neurosci. 2023. PMID: 36714530 Free PMC article.
-
Fast simulation of extracellular action potential signatures based on a morphological filtering approximation.J Comput Neurosci. 2020 Feb;48(1):27-46. doi: 10.1007/s10827-019-00735-3. Epub 2020 Jan 17. J Comput Neurosci. 2020. PMID: 31953614
References
-
- Yoshimura Y, Dantzker JLM, Callaway EM. Excitatory cortical neurons form fine-scale functional networks. Nature. 2005;433:868–873. - PubMed
-
- Buzsáki G, Draguhn A. Neuronal oscillations in cortical networks. Science. 2004;304:1926–1929. - PubMed
-
- Steriade M. Neuronal Substrates of Sleep and Epilepsy. Cambridge, UK: Cambridge Univ Press; 2003.
Publication types
MeSH terms
Grants and funding
LinkOut - more resources
Full Text Sources
