

Allowing for population stratification in association analysis
- PMID: 22307710
- PMCID: PMC3589145
- DOI: 10.1007/978-1-61779-555-8_21
Allowing for population stratification in association analysis
Abstract
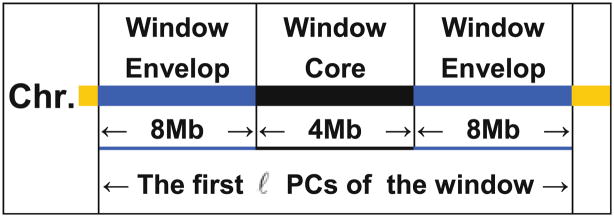
In genetic association studies, it is necessary to correct for population structure to avoid inference bias. During the past decade, prevailing corrections often only involved adjustments of global ancestry differences between sampled individuals. Nevertheless, population structure may vary across local genomic regions due to the variability of local ancestries associated with natural selection, migration, or random genetic drift. Adjusting for global ancestry alone may be inadequate when local population structure is an important confounding factor. In contrast, adjusting for local ancestry can more effectively prevent false-positives due to local population structure. To more accurately locate disease genes, we recommend adjusting for local ancestries by interrogating local structure. In practice, locus-specific ancestries are usually unknown and cannot be accurately inferred when ancestral population information is not available. For such scenarios, we propose employing local principal components (PC) to represent local ancestries and adjusting for local PCs when testing for genotype-phenotype association. With an acceptable computation burden, the proposed algorithm successfully eliminates the known spurious association between SNPs in the LCT gene and height due to the population structure in European Americans.
Figures


Similar articles
-
Calibrating Population Stratification in Association Analysis.Methods Mol Biol. 2017;1666:441-453. doi: 10.1007/978-1-4939-7274-6_21. Methods Mol Biol. 2017. PMID: 28980258 Free PMC article.
-
Interrogating local population structure for fine mapping in genome-wide association studies.Bioinformatics. 2010 Dec 1;26(23):2961-8. doi: 10.1093/bioinformatics/btq560. Epub 2010 Sep 30. Bioinformatics. 2010. PMID: 20889494 Free PMC article.
-
Global analysis of population stratification using a smart panel of 27 continental ancestry-informative SNPs.Forensic Sci Int Genet. 2018 Jul;35:e10-e12. doi: 10.1016/j.fsigen.2018.05.006. Epub 2018 May 18. Forensic Sci Int Genet. 2018. PMID: 29803513
-
Robust inference of population structure for ancestry prediction and correction of stratification in the presence of relatedness.Genet Epidemiol. 2015 May;39(4):276-93. doi: 10.1002/gepi.21896. Epub 2015 Mar 23. Genet Epidemiol. 2015. PMID: 25810074 Free PMC article.
-
Using ancestry-informative markers to define populations and detect population stratification.J Psychopharmacol. 2006 Jul;20(4 Suppl):19-26. doi: 10.1177/1359786806066041. J Psychopharmacol. 2006. PMID: 16785266 Review.
Cited by
-
Sequence Variant in the TRIM39-RPP21 Gene Readthrough is Shared Across a Cohort of Arabian Foals Diagnosed with Juvenile Idiopathic Epilepsy.J Genet Mutat Disord. 2022 Jan;1(1):103. J Genet Mutat Disord. 2022. PMID: 35465405 Free PMC article.
-
A powerful nonparametric statistical framework for family-based association analyses.Genetics. 2015 May;200(1):69-78. doi: 10.1534/genetics.115.175174. Epub 2015 Mar 5. Genetics. 2015. PMID: 25745024 Free PMC article.
References
Publication types
MeSH terms
Grants and funding
LinkOut - more resources
Full Text Sources
Miscellaneous
