. 2012 Dec;68(6):1785-97.
doi: 10.1002/mrm.24189. Epub 2012 Feb 3.

Nonrigid motion correction in 3D using autofocusing with localized linear translations

Affiliations

Nonrigid motion correction in 3D using autofocusing with localized linear translations

Joseph Y Cheng et al. Magn Reson Med. 2012 Dec.

Abstract

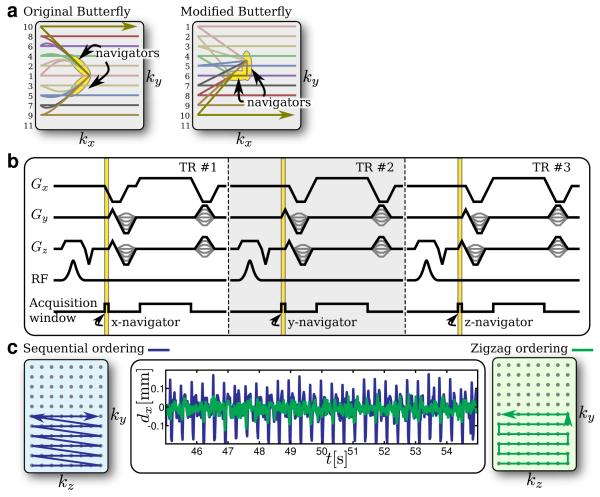
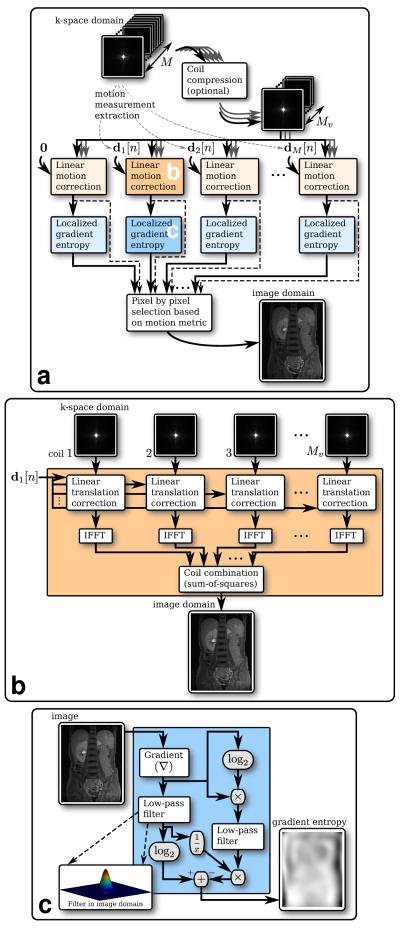
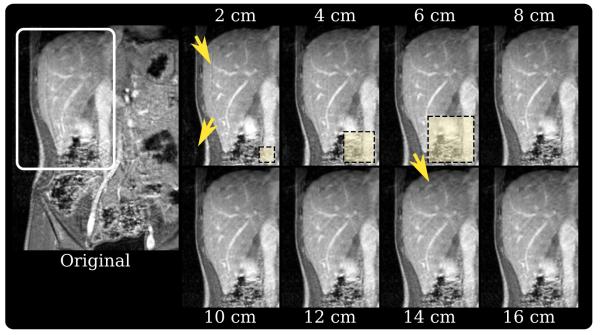
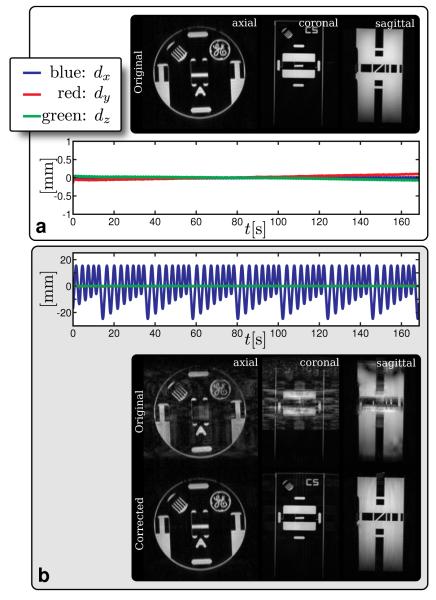
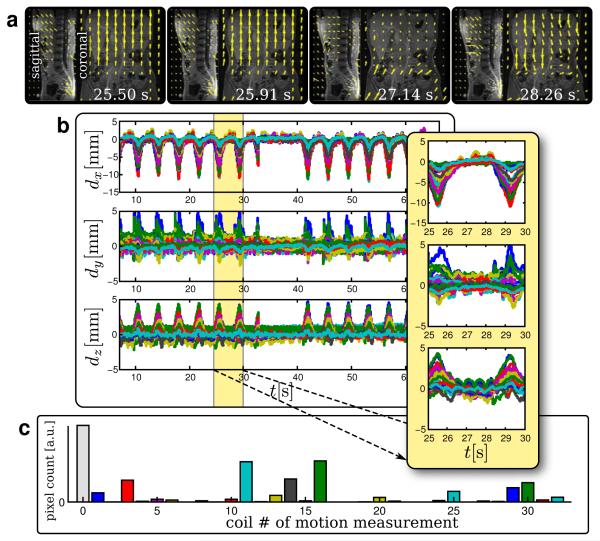
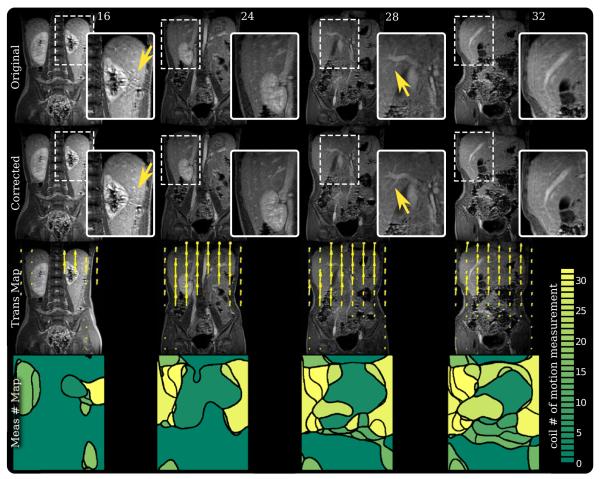
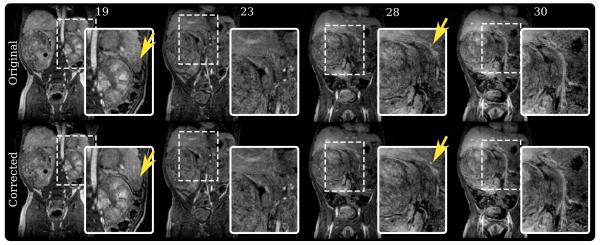
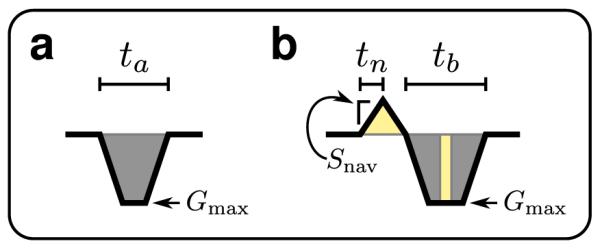
MR scans are sensitive to motion effects due to the scan duration. To properly suppress artifacts from nonrigid body motion, complex models with elements such as translation, rotation, shear, and scaling have been incorporated into the reconstruction pipeline. However, these techniques are computationally intensive and difficult to implement for online reconstruction. On a sufficiently small spatial scale, the different types of motion can be well approximated as simple linear translations. This formulation allows for a practical autofocusing algorithm that locally minimizes a given motion metric--more specifically, the proposed localized gradient-entropy metric. To reduce the vast search space for an optimal solution, possible motion paths are limited to the motion measured from multichannel navigator data. The novel navigation strategy is based on the so-called "Butterfly" navigators, which are modifications of the spin-warp sequence that provides intrinsic translational motion information with negligible overhead. With a 32-channel abdominal coil, sufficient number of motion measurements were found to approximate possible linear motion paths for every image voxel. The correction scheme was applied to free-breathing abdominal patient studies. In these scans, a reduction in artifacts from complex, nonrigid motion was observed.


Figures

FIG. 1
FIG. 1
Butterfly navigator sequence. a: Two-dimensional Butterfly trajectory – original trajectory (left) and proposed trajectory (right). b: Pulse sequence timing diagram for an example three-dimensional Butterfly trajectory. c: Phase/slice encoding effect on the motion measurement – sequential phase/slice encode ordering (left), zigzag phase/slice encode ordering (right), and resulting motion measurements dx for a motionless scan (middle). In (a), the phase-encode ordering is numbered on the left. For the modified Butterfly trajectory, this is just an example of a possible ordering.
FIG. 2
FIG. 2
Non-rigid motion correction overview. a: Correction scheme using data from an M-channel coil array. b: Linear translational motion correction 29 using motion measurement d1[n]. c: Localized gradient entropy calculation (Eq. 12).
FIG. 3
FIG. 3
Comparison of different window widths bc for the localized gradient entropy calculations. The window widths bc = 2 cm, 4 cm, and 6 cm are shown for scale. When bc = 2 cm, the arteries appear sharper; however, the ghosting artifact from the fat wall is introduced. Additionally, noise amplification can be noticed outside the body. With bc = 14 cm, the arteries blur and a faint ghosting artifact appears above the liver; this region cannot be successfully approximated as linear translations. For a nice balance, bc = 10 cm is used for our corrections. This corresponds to a full width at half maximum of 5 cm.
FIG. 4
FIG. 4
Phantom study results. a: Motionless scan verified the stability of the motion measurements. b: Rigid body translation validated the accuracy of the measurements and correction. For both (a) and (b), dx = superior/inferior motion, dy = right/left motion, and dz = anterior/posterior motion. In (a), a drift of < 0.25 mm was observed for a span of 170 s; this is negligible compared to actual motion, and could be corrected by polynomial fitting. In (b), the motion was accurately measured as shown in the plot. This measurement successfully corrected for significant motion. Some residual ghosting artifacts remained due to gradient nonlinearity.
FIG. 5
FIG. 5
Study 1 motion measurements. a: Resulting translation maps displayed in the sagittal (at −77.6 mm from isocenter) and coronal (at 5.8 mm from isocenter) slices at select time points accurately depicting the respiratory motion. b: Motion measurements acquired, where each color is a motion estimate from a different coil c: Histogram plot of number of pixels that was focused by each motion path – the number of pixels gives an idea of the scan volume that was focused by each measurement. In (c), the motion measurement number corresponds to the coil that observed that motion. Measurement number 0 corresponds to the case of no motion. (a) and (b) accurately depict the respiratory motion. Stationary regions in the lower torso were recognized by the algorithm. As expected, each coil observed a different degree of movement.
FIG. 6
FIG. 6
Study 1 results – an abdominal study performed on a 6-year-old patient using a three-dimensional SPGR sequence. first row: Slice 16, 24, 28, and 32 of the original uncorrected three-dimensional volume. second row: Same slices from the corrected volume. third row: Derived translation maps in the coronal plane. fourth row: Maps of the motion measurement number used to correct each pixel. Measurement number maps demonstrate that the motion measured from one coil can extend beyond where that coil is most sensitive. Additionally, correcting with the nearest and most sensitive coil does not always yield optimal results. Ghosting artifacts were suppressed in slice 16. An increase in sharpness and structure can be seen in the liver vessels in slice 28.
FIG. 7
FIG. 7
Study 2 results – an abdominal study of a 2-year-old patient with a renal tumor scanned using a three-dimensional SPGR sequence. top row: Slice 19, 23, 28, and 30 of the original uncorrected three-dimensional volume. bottom row: Same slices from the corrected volume. Ghosting artifacts in slice 19 were suppressed, and the tissue planes were sharpened. In slice 23, a lesion became better defined after correction.
FIG. 8
FIG. 8
Butterfly time penalty analysis. a: Original phase-encode gradient. b: Butterfly modified phase-encode gradient. For equivalent acquisitions, the total gradient areas in (a) and (b) must be equal. The gradients are designed such that the light-yellow shaded regions have the same areas and the dark-gray shaded regions have the same areas.

References

    1. Wood M, Henkelman R. MR image artifacts from periodic motion. Med Phys. 1985;12:143–151. - PubMed
    1. Plathow C, Ley S, Zaporozhan J, Schöbinger M, Gruenig E, Puderbach M, Eichinger M, Meinzer HP, Zuna I, Kauczor HU. Assessment of reproducibility and stability of different breath-hold maneuvres by dynamic MRI: comparison between healthy adults and patients with pulmonary hypertension. Eur Radiol. 2006;16:173–179. - PubMed
    1. Ehman RL, McNamara MT, Pallack M, Hricak H, Higgins CB. Magnetic resonance imaging with respiratory gating: techniques and advantages. AJR Am J Roentgenol. 1984;143:1175–1182. - PubMed
    1. Lanzer P, Botvinick E, Schiller N, Crooks L, Arakawa M, Kaufman L, Davis P, Herfkens R, Lipton M, Higgins C. Cardiac imaging using gated magnetic resonance. Radiology. 1984;150:121. - PubMed
    1. Ehman R, Felmlee J. Adaptive technique for high-definition MR imaging of moving structures. Radiology. 1989;173:255–263. - PubMed

Publication types