

Exploring tomato gene functions based on coexpression modules using graph clustering and differential coexpression approaches
- PMID: 22307966
- PMCID: PMC3343727
- DOI: 10.1104/pp.111.188367
Exploring tomato gene functions based on coexpression modules using graph clustering and differential coexpression approaches
Abstract
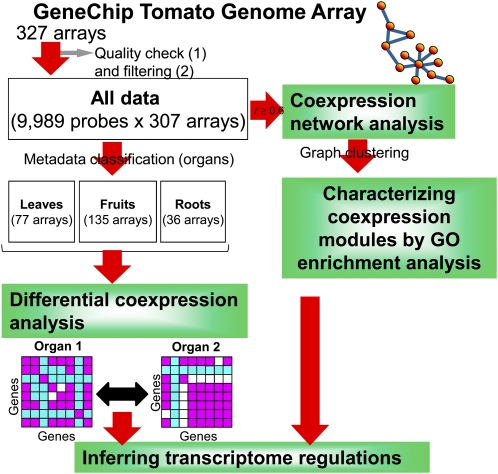
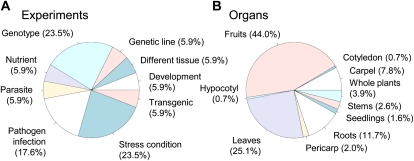
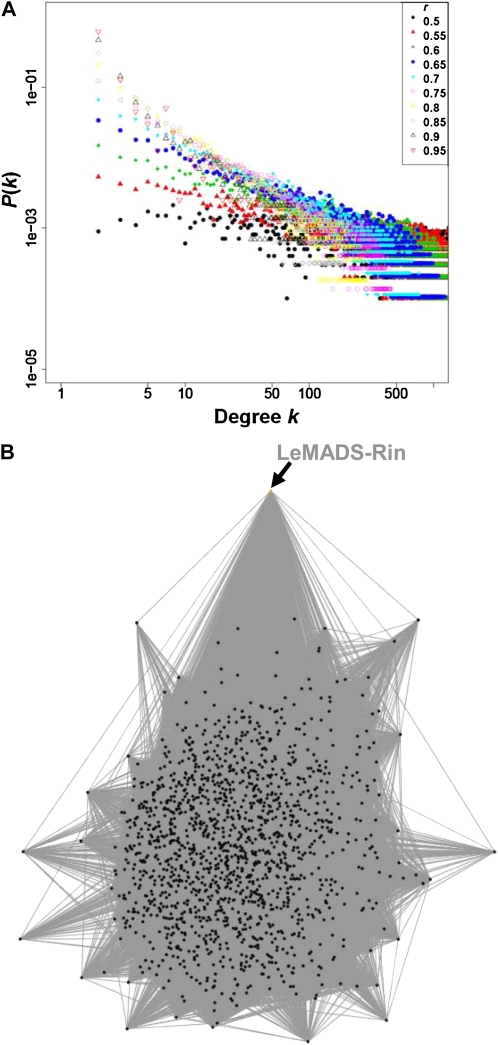
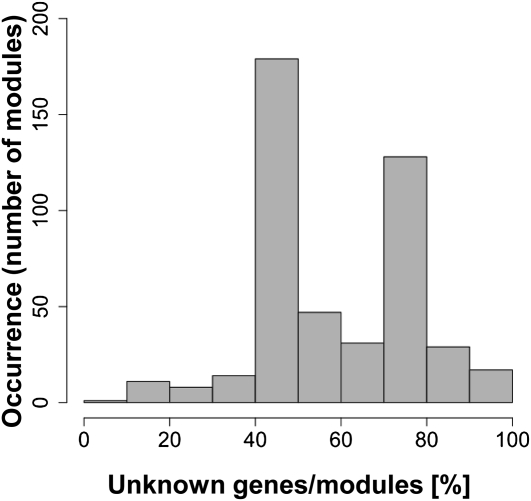
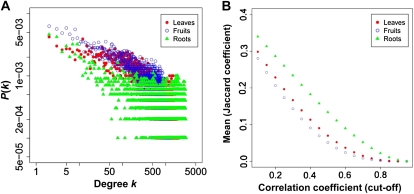
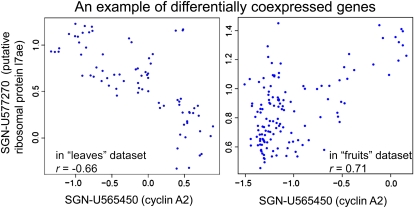
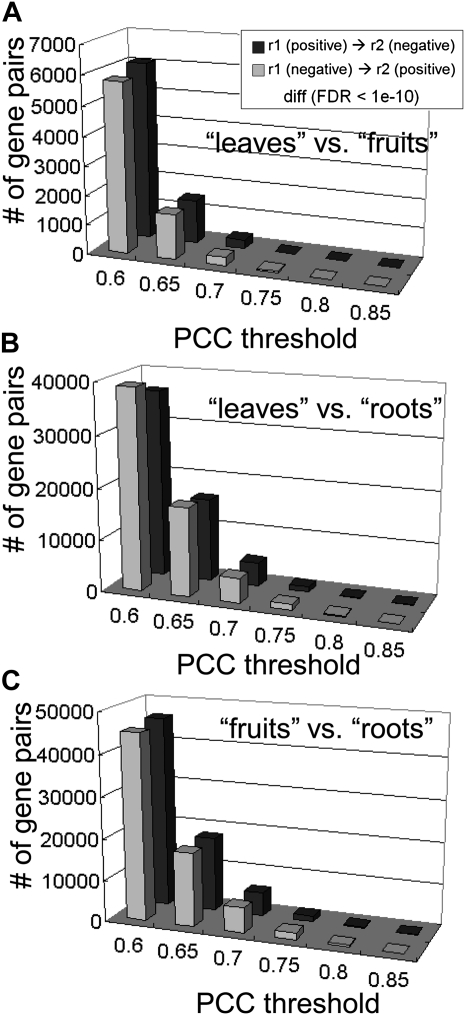
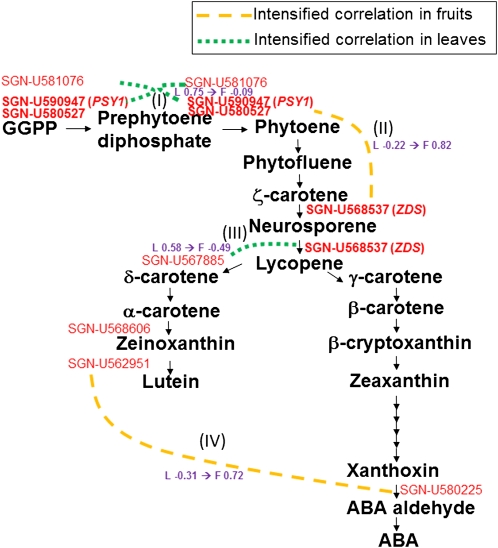
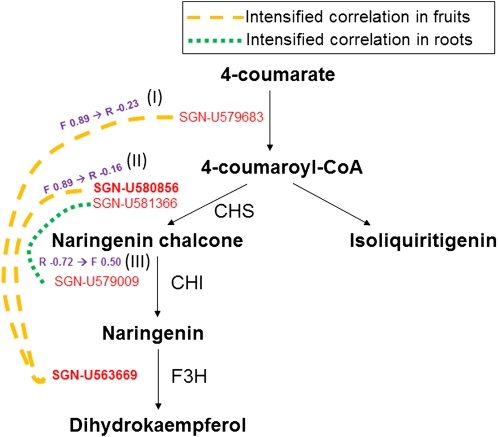
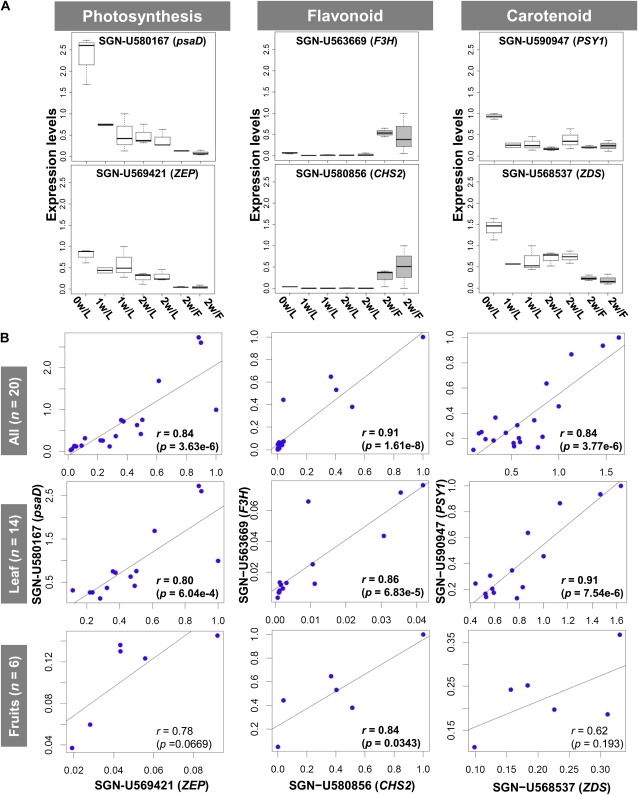
Gene-to-gene coexpression analysis provides fundamental information and is a promising approach for predicting unknown gene functions in plants. We investigated various associations in the gene expression of tomato (Solanum lycopersicum) to predict unknown gene functions in an unbiased manner. We obtained more than 300 microarrays from publicly available databases and our own hybridizations, and here, we present tomato coexpression networks and coexpression modules. The topological characteristics of the networks were highly heterogenous. We extracted 465 total coexpression modules from the data set by graph clustering, which allows users to divide a graph effectively into a set of clusters. Of these, 88% were assigned systematically by Gene Ontology terms. Our approaches revealed functional modules in the tomato transcriptome data; the predominant functions of coexpression modules were biologically relevant. We also investigated differential coexpression among data sets consisting of leaf, fruit, and root samples to gain further insights into the tomato transcriptome. We now demonstrate that (1) duplicated genes, as well as metabolic genes, exhibit a small but significant number of differential coexpressions, and (2) a reversal of gene coexpression occurred in two metabolic pathways involved in lycopene and flavonoid biosynthesis. Independent experimental verification of the findings for six selected genes was done using quantitative real-time polymerase chain reaction. Our findings suggest that differential coexpression may assist in the investigation of key regulatory steps in metabolic pathways. The approaches and results reported here will be useful to prioritize candidate genes for further functional genomics studies of tomato metabolism.
Figures
Similar articles
-
Coexpression analysis of tomato genes and experimental verification of coordinated expression of genes found in a functionally enriched coexpression module.DNA Res. 2010 Apr;17(2):105-16. doi: 10.1093/dnares/dsq002. Epub 2010 Feb 3. DNA Res. 2010. PMID: 20130013 Free PMC article.
-
Characterization of P450 carotenoid beta- and epsilon-hydroxylases of tomato and transcriptional regulation of xanthophyll biosynthesis in root, leaf, petal and fruit.Plant Cell Physiol. 2011 May;52(5):851-65. doi: 10.1093/pcp/pcr037. Epub 2011 Mar 29. Plant Cell Physiol. 2011. PMID: 21450689
-
Deciphering ascorbic acid regulatory pathways in ripening tomato fruit using a weighted gene correlation network analysis approach.J Integr Plant Biol. 2013 Nov;55(11):1080-91. doi: 10.1111/jipb.12079. Epub 2013 Aug 23. J Integr Plant Biol. 2013. PMID: 23718676
-
Recent advances in gene function prediction using context-specific coexpression networks in plants.F1000Res. 2019 Feb 5;8:F1000 Faculty Rev-153. doi: 10.12688/f1000research.17207.1. eCollection 2019. F1000Res. 2019. PMID: 30800290 Free PMC article. Review.
-
Omics applications: towards a sustainable protection of tomato.Appl Microbiol Biotechnol. 2020 May;104(10):4185-4195. doi: 10.1007/s00253-020-10500-7. Epub 2020 Mar 17. Appl Microbiol Biotechnol. 2020. PMID: 32185431 Review.
Cited by
-
The metabolic changes that effect fruit quality during tomato fruit ripening.Mol Hortic. 2022 Jan 20;2(1):2. doi: 10.1186/s43897-022-00024-1. Mol Hortic. 2022. PMID: 37789428 Free PMC article. Review.
-
Soybean gene co-expression network analysis identifies two co-regulated gene modules associated with nodule formation and development.Mol Plant Pathol. 2023 Jun;24(6):628-636. doi: 10.1111/mpp.13327. Epub 2023 Mar 28. Mol Plant Pathol. 2023. PMID: 36975024 Free PMC article.
-
CytoCluster: A Cytoscape Plugin for Cluster Analysis and Visualization of Biological Networks.Int J Mol Sci. 2017 Aug 31;18(9):1880. doi: 10.3390/ijms18091880. Int J Mol Sci. 2017. PMID: 28858211 Free PMC article.
-
Transcriptional regulation of tocopherol biosynthesis in tomato.Plant Mol Biol. 2013 Feb;81(3):309-25. doi: 10.1007/s11103-012-0001-4. Epub 2012 Dec 18. Plant Mol Biol. 2013. PMID: 23247837
-
A Systems Analysis With "Simplified Source-Sink Model" Reveals Metabolic Reprogramming in a Pair of Source-to-Sink Organs During Early Fruit Development in Tomato by LED Light Treatments.Front Plant Sci. 2018 Oct 9;9:1439. doi: 10.3389/fpls.2018.01439. eCollection 2018. Front Plant Sci. 2018. PMID: 30364178 Free PMC article.
References
-
- Altschul SF, Gish W, Miller W, Myers EW, Lipman DJ. (1990) Basic local alignment search tool. J Mol Biol 215: 403–410 - PubMed
-
- Aoki K, Ogata Y, Shibata D. (2007) Approaches for extracting practical information from gene co-expression networks in plant biology. Plant Cell Physiol 48: 381–390 - PubMed
-
- Barabási AL, Oltvai ZN. (2004) Network biology: understanding the cell’s functional organization. Nat Rev Genet 5: 101–113 - PubMed
Publication types
MeSH terms
LinkOut - more resources
Full Text Sources
Molecular Biology Databases
