. 2012 Apr;11(4):401-16.
doi: 10.1128/EC.05186-11. Epub 2012 Feb 3.

Evidence of an evolutionarily conserved LMBR1 domain-containing protein that associates with endocytic cups and plays a role in cell migration in dictyostelium discoideum

Affiliations

Evidence of an evolutionarily conserved LMBR1 domain-containing protein that associates with endocytic cups and plays a role in cell migration in dictyostelium discoideum

Jessica S Kelsey et al. Eukaryot Cell. 2012 Apr.

Abstract

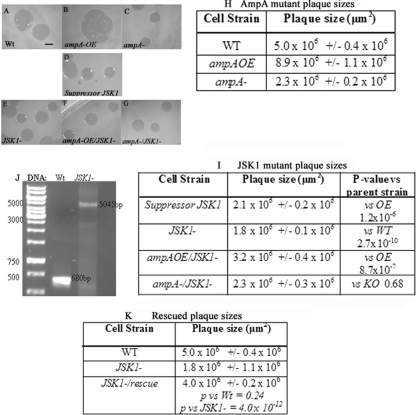
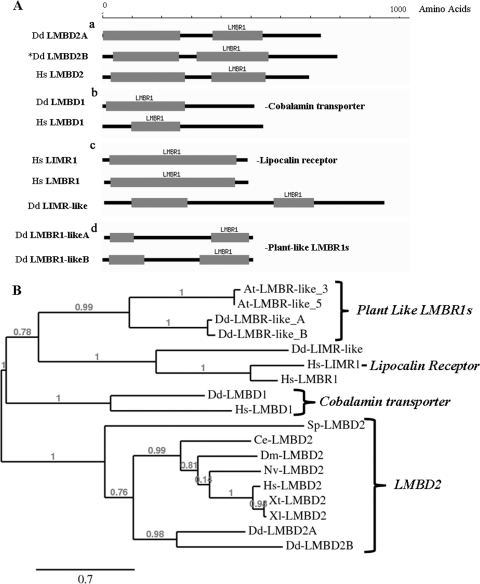
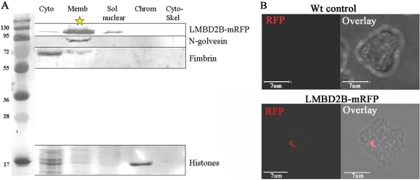
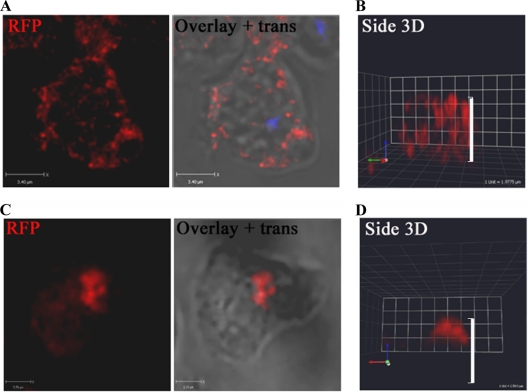
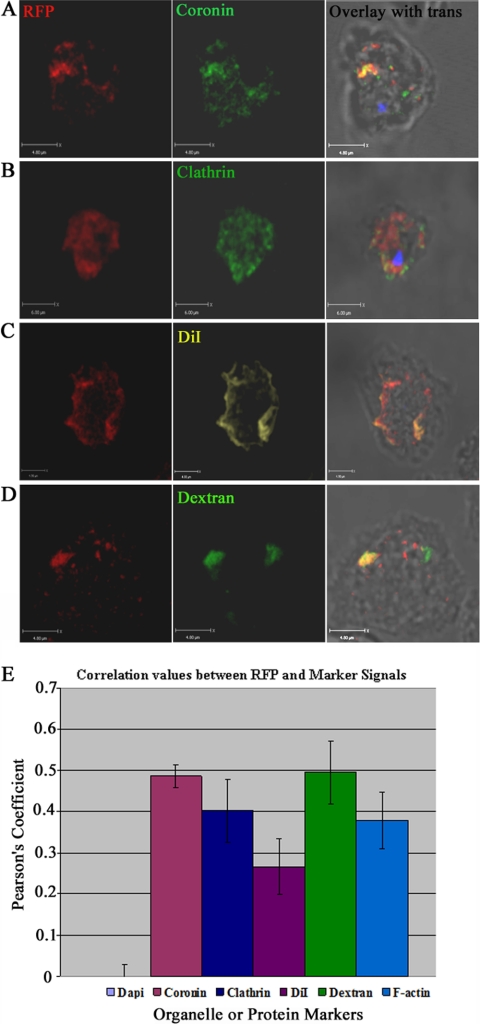
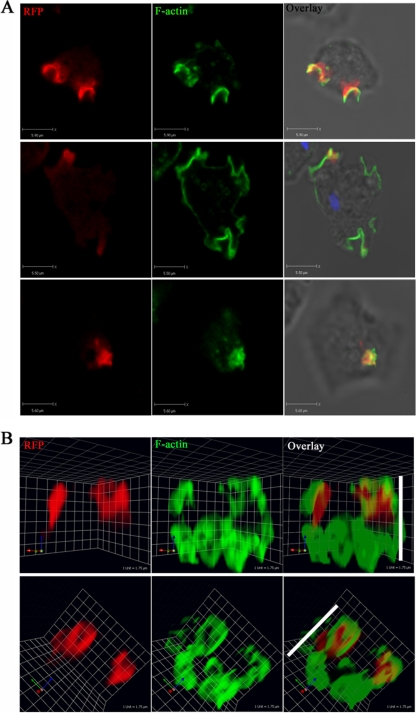
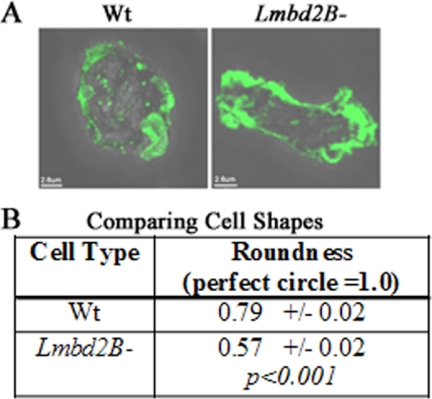
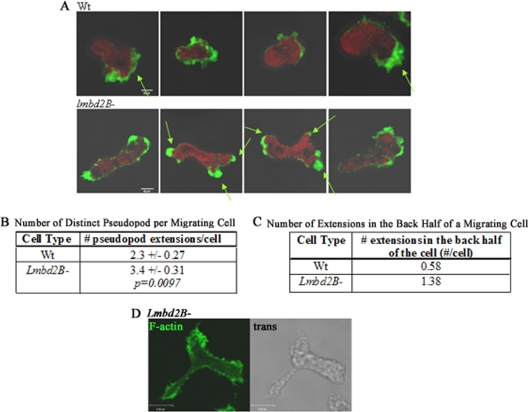
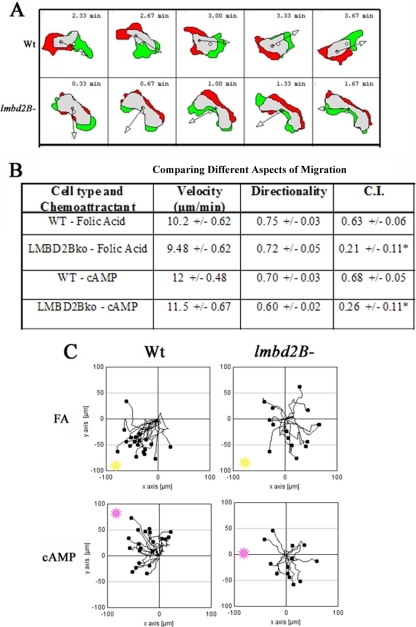
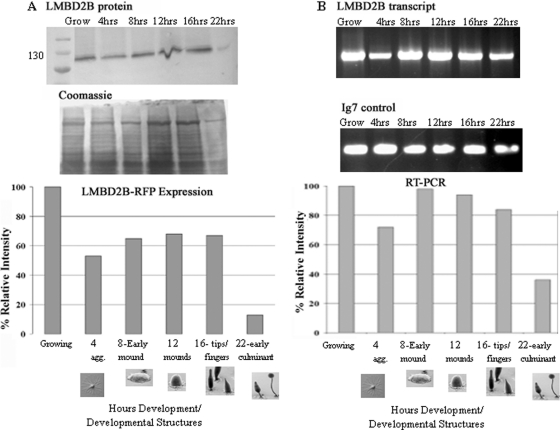
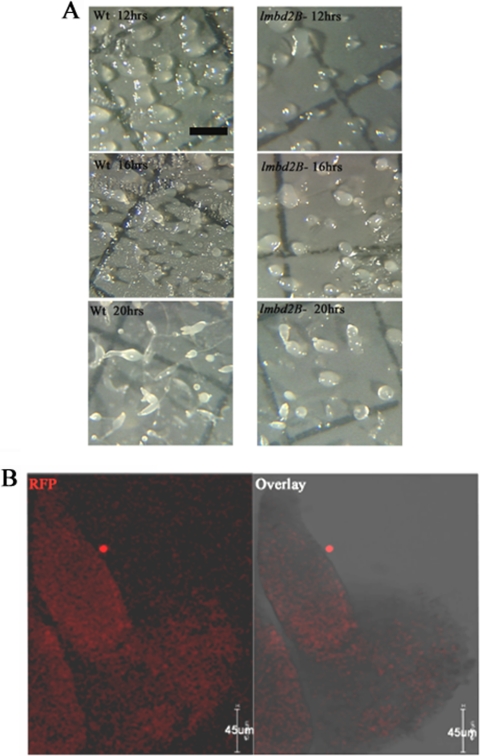
The ampA gene plays a role in Dictyostelium discoideum cell migration. Loss of ampA function results in reduced ability of growing cells to migrate to folic acid and causes small plaques on bacterial lawns, while overexpression of AmpA results in a rapid-migration phenotype and correspondingly larger plaques than seen with wild-type cells. To help understand how the ampA gene functions, second-site suppressors were created by restriction enzyme-mediated integration (REMI) mutagenesis. These mutants were selected for their ability to reduce the large plaque size of the AmpA overexpresser strain. The lmbd2B gene was identified as a suppressor of an AmpA-overexpressing strain. The lmbd2B gene product belongs to the evolutionarily conserved LMBR1 protein family, some of whose known members are endocytic receptors associated with human diseases, such as anemia. In order to understand lmbd2B function, mRFP fusion proteins were created and lmbd2B knockout cell lines were established. Our findings indicate that the LMBD2B protein is found associated with endocytic cups. It colocalizes with proteins that play key roles in endocytic events and is localized to ruffles on the dorsal surfaces of growing cells. Vegetative lmbd2B-null cells display defects in cell migration. These cells have difficulty sensing the chemoattractant folic acid, as indicated by a decrease in their chemotactic index. lmbd2B-null cells also appear to have difficulty establishing a front/back orientation to facilitate migration. A role for lmbd2B in development is also suggested. Our research gives insight into the function of a previously uncharacterized branch of the LMBR1 family of proteins. We provide evidence of an LMBR1 family plasma membrane protein that associates with endocytic cups and plays a role in chemotaxis.


Figures

Fig 1
Fig 1
Plaque sizes of potential suppressors of the ampA overexpresser phenotype. Cells were spread on LP plates with E. coli B/r and incubated at 22°C for 4 days. (A to I) Plaques were photographed on a dissecting scope (A to G), and the areas of the plaques were estimated using Metamorph (H and I). The cell types are indicated, as well as P values with the cell types tested against. The scale bar represents 1,000 μm. n > 17 plaques from at least 3 platings. (J) PCR results showing integration of the plasmid into the gene in JSK1 cells. Primers hybridized to sites flanking the REMI insert in the JSK1 gene. WT cells produce a 680-bp fragment. JSK1 cells produce a 5,045-bp fragment (4,365-bp pGEM3 plus 680-bp sequence). (K) Plaque sizes of the rescued JSK1 cells (by expressing an extrachromosomal copy of the gene in JSK1 cells).
Fig 2
Fig 2
Domain structure and phylogenetic analysis of LMBR1 domain-containing proteins. (A) LMBR1 domain-containing proteins are displayed, with their LMBR1 domains represented by gray blocks. The scale shows the length in amino acids. (a) LMBR1-containing type 2 proteins (LMBD2): Dd-LMBD2A (sp|Q54Q92 D. discoideum), Dd-LMBD2B (sp|Q54TM2 D. discoideum), and Hs-LMBD2 (sp|Q68DH5 H. sapiens). (b) LMBR1-containing type 1 proteins that are probable cobalamin transporters: Dd-LMBD1 (sp|Q54KD1 D. discoideum) and Hs-LMBD1 (sp|Q9NUN5 H. sapiens). (c) The lipocalin 1 receptor: Hs-LIMR1 (sp|Q6UX01 H. sapiens) and the limb region 1 protein homologue, Hs-LMBR1 (sp|Q8WVP7 H. sapiens), as well as Dd-LIMR-like (XP_645368.1 D. discoideum). (d) The two plant-like LMBR1 proteins: Dd-LMBR1-likeA (sp|Q54BI3 D. discoideum) and Dd-LMBR1-likeB (sp|Q54QP7 D. discoideum) (34, 35, 36). (B) Phylogenetic analysis of LMBR1 domain-containing proteins across species using Muscle v3.7 on the phylogeny.fr platform. The phylogenetic tree was constructed using the maximum- likelihood method implemented in the PhyML program v3.0 aLRT and was drawn using TreeDyn v198.3 (12). Sequences utilized included the Dictyostelium and human protein sequences from panel A, as well as the protein sequences for Xt-LMBD2 (NP_001123692 X. tropicalis), Xl-LMBD2 (NP_001080584 X. laevis), Nv-LMBD2 (XP_001637236 N. vectensis), At-LMBR1-like 3 (sp|Q9SR93 Arabidopsis thaliana), At-LMBR1-like 5 (sp|Q9M028 A. thaliana), Dm-LMBD2 (gb|AAF54372 D. melanogaster), Ce-LMBD2 (NP_496413 C. elegans), and Sp-LMBD2 (NP_588183 S. pombe).
Fig 3
Fig 3
The LMBD2B protein is localized to the plasma membrane. (A) Cell fractionation using the Thermo Scientific subcellular protein fractionation kit. The fractions were run on SDS-PAGE, transferred, and probed with an appropriate antibody. A molecular mass ladder (kDa) is in the far left lane, followed by fractions: cytosolic (Cyto), membrane (Memb), soluble (Sol) nuclear, chromatin bound (Chrom), and cytoskeletal (Cyto-Skel). An RFP antibody was used to detect LMBD2B-mRFP. To detect Golgi and Golgi-derived vesicle locations, GFP–N-golvesin (91 kDa) and a GFP antibody were used. Localization of the soluble actin binding protein fimbrin is shown, as well (fimbrin antibody, 67 kDa). The Coomassie staining showed histone localization to the chromatin fraction (∼17 kDa). The 116-kDa LMBD2B-mRFP protein was mostly localized to the membrane fraction. (B) Indirect immunofluorescence using the RFP antibody is shown for both WT control cells and LMBD2B-mRFP cells. The WT control is a 3D flattened image displaying little or no RFP fluorescence in the cell. Below is shown immunofluorescent LMBD2B localization in a nonpermeabilized cell. Growing cells were placed on a coverslip for 2 h, fixed, and stained (as described in Materials and Methods, with the methanol step of permeabilization omitted). A dorsally shifted Z-axis slice (a slice through the top of the cell) is displayed. Overlays of fluorescence on transmitted images are also shown. LMBD2B fluorescence is indicated by the red signal. LMBD2B was detected on the dorsal surface of the cell.
Fig 4
Fig 4
LMBD2B is localized in punctate regions on the cell periphery but clusters with prolonged substrate contact. Growing cells were placed on a coverslip for 15 min (A and B) or >2 h (C and D), fixed, and stained. Images of LMBD2B-mRFP indirect immunofluorescence are shown. Overlays of fluorescence over transmitted (trans) images are also shown. LMBD2B fluorescence is indicated by the red signal. (A and C) Z-axis slices through a cell (blue signal indicates nuclei stained with DAPI). (B and D) Side views of 3D-reconstructed cells; the white side bars indicate cell height.
Fig 5
Fig 5
Colocalization of LMBD2B with endocytic and membrane markers. Growing cells were placed on a coverslip, fixed, and stained. Images of LMBD2B-mRFP indirect immunofluorescence are displayed on the left, other protein markers in the center, and overlays with transmitted light images on the right. (A) Coronin Ab. (B) Clathrin Ab. (C) DiI. (D) FITC-dextran. LMBD2B fluorescence is indicated by the red signal. All images are Z-axis slices through a cell. Blue signal indicates nuclei stained with DAPI. Yellow/orange signal indicates colocalization. (E) Values of colocalization. A positive correlation is indicated by a positive Pearson's coefficient. Colocalization of LMBD2B with DAPI was used as a negative control, since there should be no colocalization, so the value would represent 0 correlation. n > 30 cells from at least 2 rounds of fixations. The error bars indicate standard errors.
Fig 6
Fig 6
LMBD2B localization to actin-rich endocytic processes. Growing cells were fixed and stained. Images of LMBD2B-mRFP indirect immunofluorescence are displayed on the left, 488-phalloidin-stained F-actin is displayed in the center, and overlays with transmitted-light images are on the right. (A) Z-axis slices through a cell. Blue signal indicates nuclear staining. (B) Side views of 3D-reconstructed cells. The white side bars indicate cell height. An overlap in signal is yellow. A positive correlation between LMBD2B-mRFP staining and F actin was determined for 21 cells from at least 3 different phalloidin stainings (Fig. 5E).
Fig 7
Fig 7
Vegetative LMBD2B-null cells show an elongated shape. Growing cells were placed on coverslips and allowed to sit overnight. The cells were stained with Alexa Fluor 488-phalloidin to label F-actin. (A) Images of the different cell types (an overlay of 3D flattened fluorescence and transmitted-light images). Polymerized actin is green. (B) Comparison of the roundness of WT and lmbd2B cells. ImageJ was used to calculate the roundness of the cells as follows; roundness = 4 × area/(π × major axis2). A perfect circle would equal a roundness of 1.0. lmbd2B cells were significantly less round (or more elongated) than WT cells. n = 25 cells from at least 3 different phalloidin stainings.
Fig 8
Fig 8
Multiple pseudopodial extensions in LMBD2B-null cells. Growing cells were forced to undergo migration by spotting folic acid near a drop of cells on coverslips. The cells were stained with Alexa Fluor 488-phalloidin to label F-actin. (A) Z-axis slices of WT and lmbd2B cells. Polymerized actin is green, and red represents G-actin. The arrows point to distinct areas of F-actin pseudopodial extensions. (B) The number of distinct pseudopods per cell was calculated. lmbd2B cells have on average one extra pseudopod per migrating cell compared to WT cells. n > 8 cells from 3 separate phalloidin staining experiments. (C) Results of counting actin-rich extensions in the rear of the migrating cells. lmbd2B cells have more pseudopods forming in the back half of a chemotaxing cell than WT cells. n > 12 cells from 3 separate phalloidin staining experiments. (D) Same as panel A but showing an actin-rich pseudopodial extension from the middle of an lmbd2B cell; a Z-axis slice of an F-actin fluorescent staining and a transmitted image are displayed.
Fig 9
Fig 9
LMBD2B-null cells are defective in chemotaxis. Images were taken every 20 s for 5 min. (A) Difference plots of chemotaxing cells are shown (DIAS). Green represents areas of extension from the previous image, red indicates retraction regions from the previous image, and gray indicates areas that remain the same. Consistency is seen in the WT cell's amount of extension and retraction at the poles of the cell. This is not the case for lmbd2B cells, which often travel sideways, extending from the broad side of a cell as opposed to one of the narrow poles. (B) Values for the velocity, directionality, and CI of WT and lmbd2B cells migrating toward folic acid and cAMP. ∗, significant difference, P < 0.05, by two-tailed student's t test. (C) Chemotaxis plots. Cells were tracked on agar every 20 s for a total of 5 min. The black dots represent cells, and their individual paths are shown by lines. The direction and distance of each cell from its origin at 0 is shown. The location of the edge of the source of chemoattractant is shown in each plot as a pink or yellow spot. In the upper plots, folic acid (FA) (yellow) and in the bottom plots cAMP (pink) was used as the chemoattractant. WT cells travel more directly toward folic acid and cAMP than lmbd2B cells. n > 30 cells from 3 or 4 separate chemotaxis experiments.
Fig 10
Fig 10
LMBD2B protein and mRNA are expressed throughout growth and development. Analysis of LMBD2B-mRFP protein expression (A) and RT-PCR with relative levels of lmbd2B transcript (B) are shown. (A) During growth and after the indicated number of hours of development, cells were washed, harvested, and run on an SDS-6% PAGE gel. (Top) After transfer, nitrocellulose was probed with an RFP antibody. The LMBD2B-mRFP product is about 116 kDa. (Bottom) Coomassie stain was used to correct quantification for unequal loading. (B) At specific time points, the RNA from the developing structures was isolated. A cDNA copy of total RNA was used for PCR. lmbd2B-specific primers were used to amplify the transcript levels in the cells. (Top) Agarose gels of the RT-PCR product of LMBD2B transcripts and Ig7 control transcripts. (Bottom) Calculation of the relative intensity of each band. The developmental pictures are from http://dictybase.org (copyright, M. J. Grimson and R. L. Blanton, Biological Sciences Electron Microscopy Laboratory, Texas Tech University; reported with permission).
Fig 11
Fig 11
LMBD2B has a role during development. (A) Cells were plated for development on nitrocellulose filters. At the indicated times (12, 16, and 20 h), images were taken using Metamorph software and a Dage-MTI video camera mounted on an Olympus dissecting microscope. The scale bar represents 1,000 μm. (B) Indirect immunofluorescence of LMBD2B-mRFP localization in whole mounts imaged on a Leica SP5 confocal microscope. Optical Z-axis slices through the developing structure are shown, with red signal indicating LMBD2B locations; shown are immunofluorescent images and overlays with transmitted images. The developing structure is a finger (∼16 h development).

Similar articles

Cited by

References

    1. Barlow AL, Macleod A, Noppen S, Sanderson J, Guérin CJ. 2010. Colocalization analysis in fluorescence micrographs: verification of a more accurate calculation of Pearson's correlation coefficient. Microsc. Microanal. 16:710–724 - PubMed
    1. Benghezal M, et al. 2003. Synergistic control of cellular adhesion by transmembrane 9 proteins. Mol. Biol. Cell 14:2890–2899 - PMC - PubMed
    1. Blumberg DD, Ho HN, Petty CL, Varney TR, Gandham S. 2002. AmpA, a modular protein containing disintegrin and ornatin domains, has multiple effects on cell adhesion and cell fate specification. J. Muscle Res. Cell Motil. 23:817–828 - PubMed
    1. Bonner JT. 1967. The cellular slime molds. Princeton University Press, Princeton, NJ
    1. Brazill DT, Meyer LR, Hatton RD, Brock DA, Gomer RH. 2001. ABC transporters required for endocytosis and endosomal pH regulation in Dictyostelium. J. Cell Sci. 114:3923–3932 - PubMed

Publication types

MeSH terms

LinkOut - more resources