. 2012 May;27(5):1018-29.
doi: 10.1002/jbmr.1567.

Demonstration of osteocytic perilacunar/canalicular remodeling in mice during lactation

Affiliations

Demonstration of osteocytic perilacunar/canalicular remodeling in mice during lactation

Hai Qing et al. J Bone Miner Res. 2012 May.

Abstract

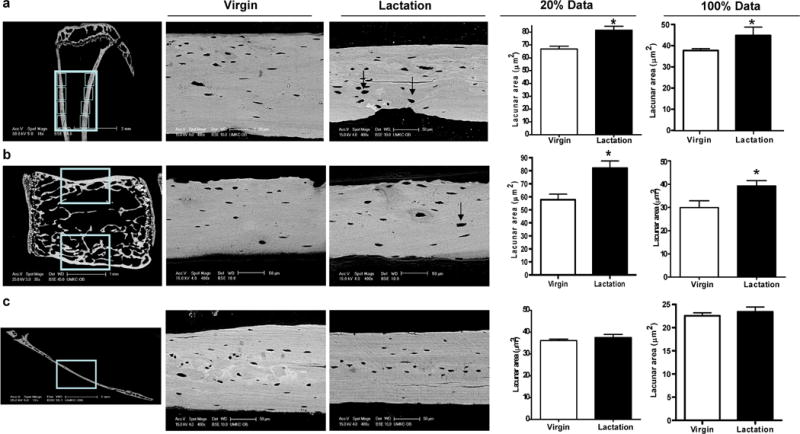
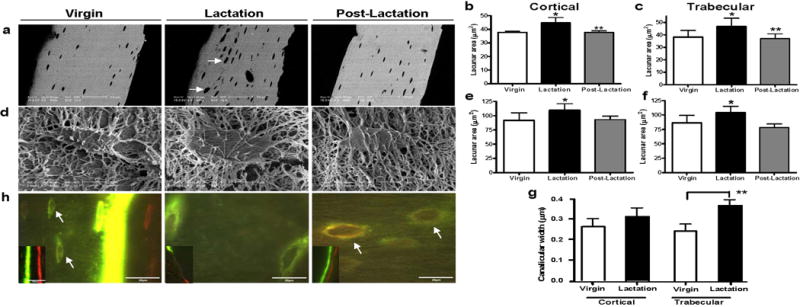
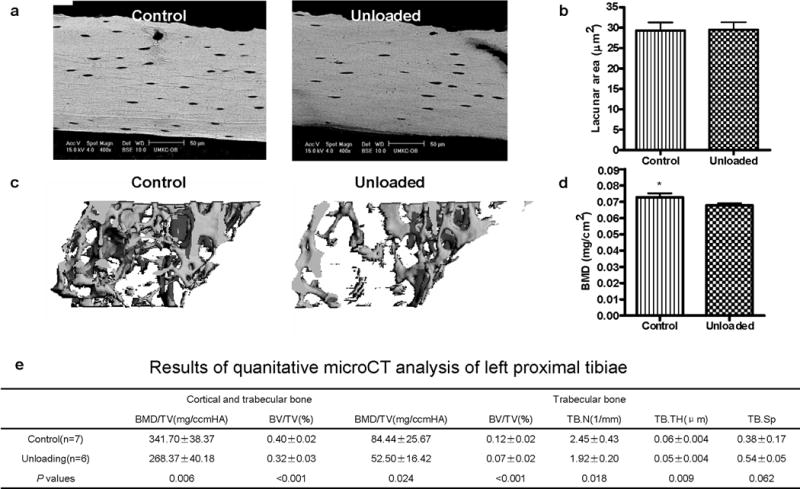
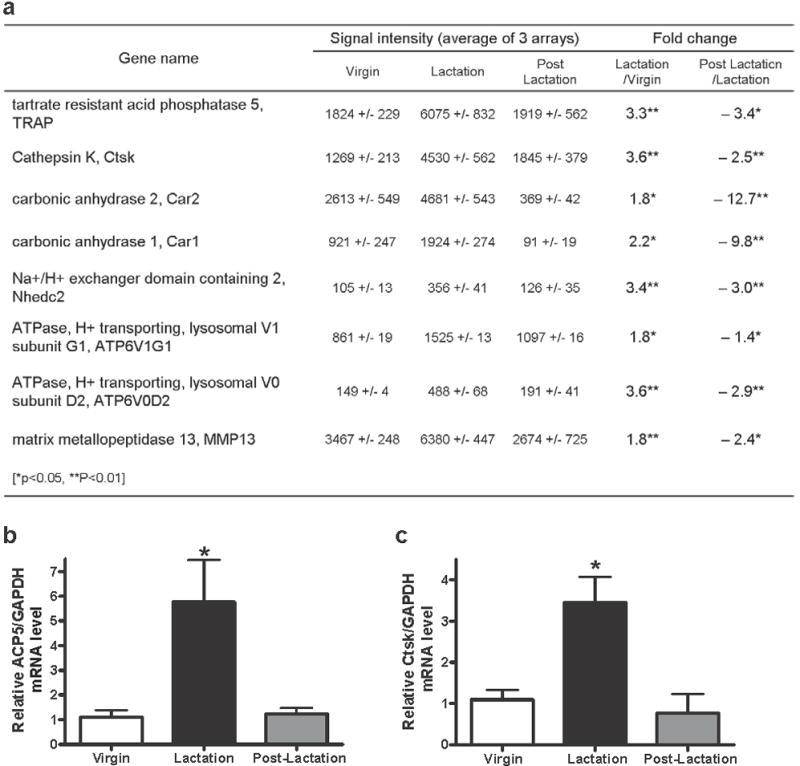
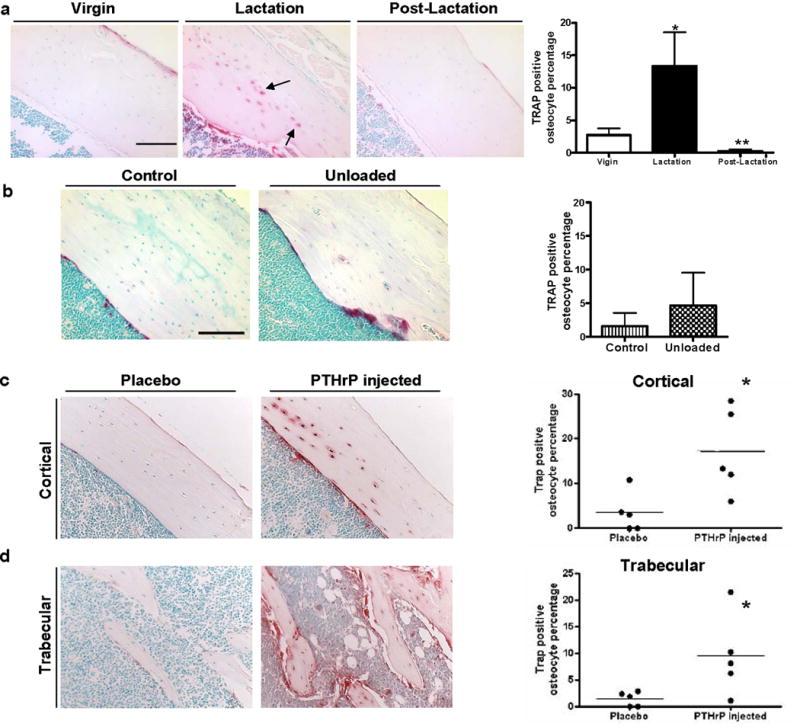
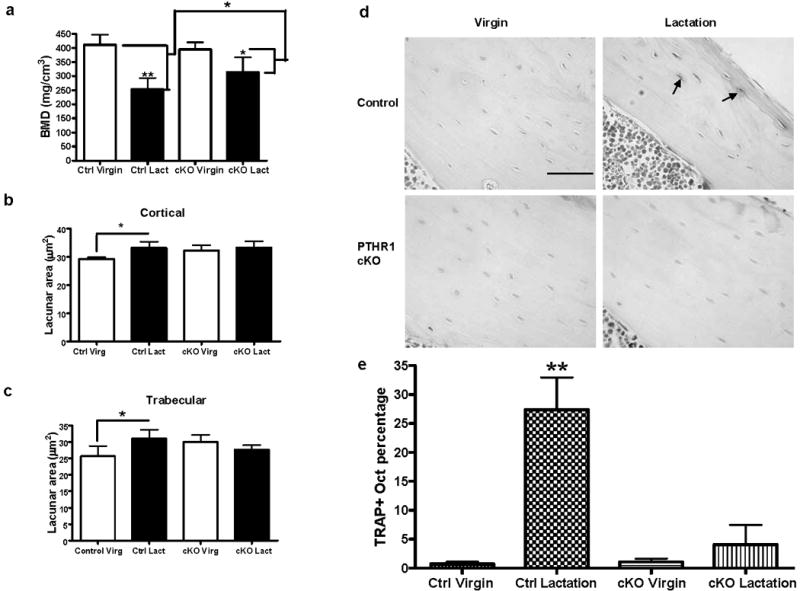
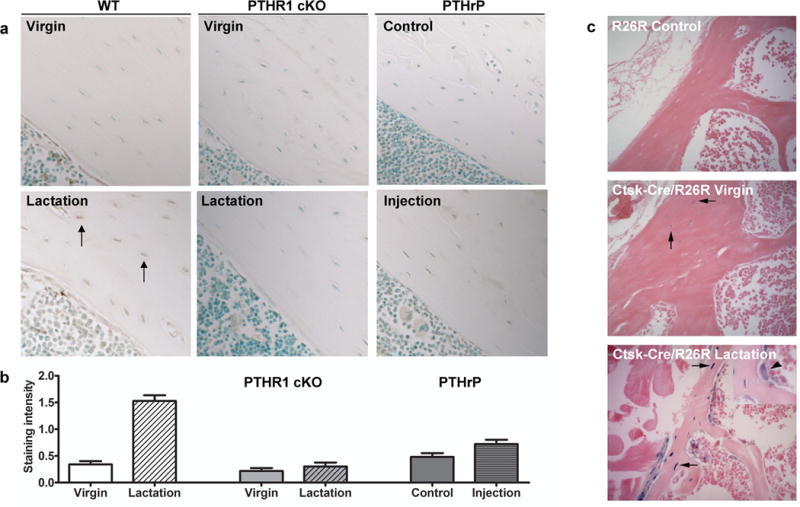
Osteoclasts are thought to be solely responsible for the removal of bone matrix. However, we show here that osteocytes can also remove bone matrix by reversibly remodeling their perilacunar/canalicular matrix during the reproductive cycle. In contrast, no osteocytic remodeling was observed with experimental unloading despite similar degrees of bone loss. Gene array analysis of osteocytes from lactating animals revealed an elevation of genes known to be utilized by osteoclasts to remove bone, including tartrate-resistant acid phosphatase (TRAP) and cathepsin K, that returned to virgin levels upon weaning. Infusion of parathyroid hormone-related peptide (PTHrP), known to be elevated during lactation, induced TRAP activity and cathepsin K expression in osteocytes concurrent with osteocytic remodeling. Conversely, animals lacking the parathyroid hormone type 1 receptor (PTHR1) in osteocytes failed to express TRAP or cathepsin K or to remodel their osteocyte perilacunar matrix during lactation. These studies show that osteocytes remove mineralized matrix through molecular mechanisms similar to those utilized by osteoclasts.


Conflict of interest statement

The authors have no conflict of interest.

Figures

Figure 1
Figure 1
Osteocyte lacunar area increases in tibiae and lumbar vertebrae, but not in parietal calvarial bone during lactation. (A) Eight BSEM images (locations are shown by boxes) were taken on the cortical bone of each tibia from virgin and lactating mice and osteocyte lacunar size was quantified. A significant increase was observed in lactating animals regardless of whether the largest 20% of lacunae were compared or 100% of lacunae. (B) BSEM images (box) were taken on the cortical bone of LV1–LV4 from virgin and lactating mice. A significant increase in osteocyte lacunar area (in m2) was observed using 20% of the largest lacunae during lactation as compared to virgin mice (*p < 0.05; n = 3). Lacunar area was also increased using 100% of the lacunae but the difference did not reach significance. BSE images showed that during lactation osteocyte lacunae enlarged with irregular borders (black arrow). (C) Sagittal sections were made 2 mm right of the middle sagittal suture in the right parietal bone. BSEM were used to image osteocyte lacunae in the middle of sagittal parietal bone (box). BSEM images of parietal bone show no obvious remodeled osteocyte lacunae. Quantitation of the BSEM images showed no significant change in osteocyte lacunar area from parietal bone during lactation compared to virgin mice (n = 8).
Figure 2
Figure 2
Lactation induces osteocytic remodeling during lactation that returns to virgin levels with postlactation. (A) BSEM showed that during lactation osteocyte lacunae enlarged with irregular borders indicating mineral removal (white arrows). (B) Osteocyte lacunar area (in μm2) was significantly increased in cortical bone during lactation as compared to virgin or 7 days postlactation. (Experiment repeated four times; *p < 0.05; **p < 0.01; n = 7–9 per group). (C) Osteocyte lacunar area (in μm2) was significantly increased in trabecular bone during lactation as compared to virgin or 7 days postlactation (*p < 0.05; **p < 0.01; n = 7–9 per group). (D) Osteocyte lacunae were imaged using acid-etch resin-casted SEM to further validate the measurements by SEM. (E) Osteocyte lacunar area measured by acid-etch resin-casted SEM was significantly increased in cortical bone during lactation as compared to virgin or 7 days postlactation (*p < 0.05; n = 4–5 per group). (F) Osteocyte lacunar area measured by acid-etch resin-casted SEM was significantly increased in trabecular bone during lactation as compared to virgin or 7 days postlactation (*p < 0.05; n = 4–5 per group). (G) The same resin-casted SEM images were also used to measure canalicular diameter. An increase in canalicular diameter was observed in cortical bone from lactating animals and a significant increase in trabecular bone (p < 0.001; n = 4–5 per group). (H) Double fluorochrome labeling. Two distinctive lines of fluorochrome labeling, calcein green (first injection) and Alizarin red (second injection), can be found at the bone surface (smaller image insert). In the virgin animal, faint label was taken up by the newly embedding osteocytes at the mineralization front (arrows in virgin). Only green labeling was observed in the lactating animals and an intermittent green label on the bone surface. Lacunae labeled with both fluorochromes (mixed green and red bands) were observed distant from the mineralization front (previously existing lacunae) in the postlactation animals (white arrows in postlactation).
Figure 3
Figure 3
Mechanical disuse does not induce osteocytic remodeling. (A) BSE imaging of osteocyte lacunae. (B) Osteocyte lacunar size was measured using backscatter SEM in the same procedures as for the lactating mouse. Even though the age-matched unloaded CD1 female mice lost BMD/TV and BV/TV (by μCT), backscatter SEM showed that the osteocyte lacunar area did not significantly change (p = 0.87; n = 7 per group) in cortical bone in hindlimb-unloaded mice compared to controls. Lack of significant differences was also observed in trabecular bone (data not shown). (C) Unloaded trabecular bone architecture by μCT showed bone loss during unloading compared to control. BMD was significantly decreased (p < 0.0001; 7.4% bone loss) in the left femur of unloaded mice compared to controls. (D) BMD (mg/cm2) significantly decreased (p = 0.01) in femur during unloading compared to ambulatory controls. A similar effect was seen in the proximal tibiae (data not shown) (*p < 0.05; n = 7 per group). (E) Table of μCT analyses. BMD = bone mineral density; BV = bone volume; TV = total volume; TB.N = trabecular number; TB.TH = trabecular bone thickness; TB.Sp = trabecular bone space.
Figure 4
Figure 4
Expression of several osteoclast-specific genes is increased in osteocytes during lactation. (A) Table of microarray data showing significantly changed genes between virgin and lactating animals and between lactating and postlactation animals (*p < 0.05; **p < 0.01; n = 3 per group). (B) Using qPCR, ACP5 (TRAP) mRNA level from isolated osteocytes relative to GAPDH was significantly increased during lactation compared to virgin control or postlactation (*p < 0.05; n = 4 per group). (C) Ctsk (cathepsin K) mRNA level from isolated osteocytes relative to GAPDH was significantly higher during lactation than virgin control or postlactation (*p < 0.05; n = 4 per group).
Figure 5
Figure 5
TRAP is increased during lactation compared to virgin or postlactation animals. No significant changes were observed with unloading. Infusion of PTHrP induces elevation of TRAP in osteocytes. (A) TRAP staining showed more TRAP-positive osteocytes during lactation (black arrows). (The periosteal surface is upper right and endocortical surface is lower left.) The percentage of osteocytes with TRAP activity from the lactating mice (13.4% ± 5.2%* TRAP+ osteocytes) was significantly increased compared to the virgin (2.7% ± 1.8%) and day 7 postlactation (0.3% ± 0.5%**) animals (*p < 0.05; **p < 0.01; n = 4–5). (B) Tartrate resistant acid phosphatase staining of tibia from control and unloaded animals. No significant difference (p = 0.28; n = 7 per group) in percent of TRAP-positive osteocytes was observed between control (1.6% ± 1.0%) and unloaded groups (4.6% ± 2.2%). (C) Cortical (the periosteal surface is upper right and endocortical surface is lower left.) and (D) trabecular bone was stained for TRAP. TRAP staining showed TRAP activity was significantly elevated in osteocytes in PTHrP-treated mice (TRAP+ osteocytes percentage 17.0% ± 4.3% in cortical bone*; 9.4% ± 3.4% in trabecular bone*) as compared to placebo-treated mice (3.4% ± 2.0% cortical; 1.4% ± 0.6% trabecular) (*p < 0.05; n = 5).
Figure 6
Figure 6
Osteocyte remodeling during lactation was blocked in osteocyte-specific PTHR1-cKO mice. (A) BMD measurement by μCT showed a decrease in bone density in both the control and the PTHR1-cKO mice during lactation. There is less bone density loss (47% attenuation) during lactation in PTHR1-cKO mice (*p < 0.05; **p < 0.01; n = 3–6 per group). (B) In control mice, osteocyte lacunar area in tibial cortical bone significantly increased during lactation compared to virgin, while lacunar area did not enlarge in the PTHR1 cKO mice with lactation (*p < 0.05; n = 3–6 per group). (C) In control mice, osteocyte lacunar area in tibial trabecular bone significantly increased during lactation compared to virgin, while lacunar area did not enlarge in the PTHR1 cKO mice with lactation (*p < 0.05; n = 3–6 per group). (D) Tartrate resistant acid phosphatase staining. A significant increase in TRAP-positive osteocytes in control mice with lactation was not observed in the PTHR1-cKO mice. (The periosteal surface is upper right and endocortical surface is lower left.) (E) In control mice, a significantly increased number of osteocytes with TRAP activity (p < 0.01) in the lactating mice (27.4% ± 9.6%** TRAP+ osteocytes) was observed compared to the virgin mice (0.7% ± 0.9%). There was no significant difference in TRAP activity from PTHR1-cKO mice during lactation (4.1% ± 8.4%) compared to virgin mice (1.1% ± 1.2%) (*p < 0.05; **p < 0.01; n = 3–6 per group).
Figure 7
Figure 7
Cathepsin K protein and gene expression is elevated in osteocytes during lactation. (A) Immunostaining for cathepsin K in osteocytes (black arrows), scale bar 100 μM. Increased staining is observed in bone from wild-type lactating animals compared to virgin animals. No obvious increases were observed in PTHR1 cKO virgin or lactating animals, nor significant differences with PTHrP-injected animals compared to vehicle control–injected animals. (B) Immunostaining was quantitated on all groups within the same experiment showing significant increases in lactating wild-type animals compared to the other groups. (C) Bone from virgin mice containing both the Ctsk-cre and the R26R showed some pale blue staining in osteocytes (arrows, middle panel), whereas bone from lactating animals showed that not only osteoclasts, but more osteocytes express LacZ and thus cathepsin K. The arrowhead (inset, lower panel) indicates the osteoclast as a positive control for beta-galactosidase staining. The R26R control bone (upper panel) shows no blue color, as expected.

Similar articles

Cited by

References

    1. Bonewald LF. The amazing osteocyte. J Bone Miner Res. 2011;26(2):229–238. - PMC - PubMed
    1. Poole KE, van Bezooijen RL, Loveridge N, Hamersma H, Papapoulos SE, Lowik CW, Reeve J. Sclerostin is a delayed secreted product of osteocytes that inhibits bone formation. Faseb J. 2005;19(13):1842–1844. - PubMed
    1. Tatsumi S, Ishii K, Amizuka N, Li M, Kobayashi T, Kohno K, Ito M, Takeshita S, Ikeda K. Targeted ablation of osteocytes induces osteoporosis with defective mechanotransduction. Cell Metab. 2007;5(6):464–475. - PubMed
    1. Feng JQ, Ward LM, Liu S, Lu Y, Xie Y, Yuan B, Yu X, Rauch F, Davis SI, Zhang S, Rios H, Drezner MK, Quarles LD, Bonewald LF, White KE. Loss of DMP1 causes rickets and osteomalacia and identifies a role for osteocytes in mineral metabolism. Nature genetics. 2006;38(11):1310–1315. - PMC - PubMed
    1. Tazawa K, Hoshi K, Kawamoto S, Tanaka M, Ejiri S, Ozawa H. Osteocytic osteolysis observed in rats to which parathyroid hormone was continuously administered. Journal of bone and mineral metabolism. 2004;22(6):524–529. - PubMed

Publication types