. 2011 Nov 15;70(1):1-51.
doi: 10.3114/sim.2011.70.01.

Phylogeny of Penicillium and the segregation of Trichocomaceae into three families

Affiliations

Phylogeny of Penicillium and the segregation of Trichocomaceae into three families

J Houbraken et al. Stud Mycol. .

Abstract

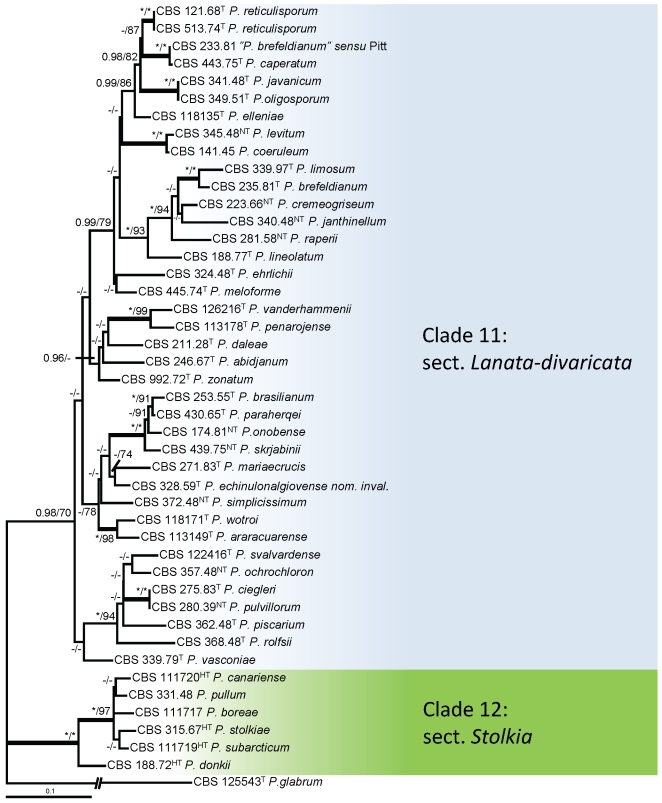
Species of Trichocomaceae occur commonly and are important to both industry and medicine. They are associated with food spoilage and mycotoxin production and can occur in the indoor environment, causing health hazards by the formation of β-glucans, mycotoxins and surface proteins. Some species are opportunistic pathogens, while others are exploited in biotechnology for the production of enzymes, antibiotics and other products. Penicillium belongs phylogenetically to Trichocomaceae and more than 250 species are currently accepted in this genus. In this study, we investigated the relationship of Penicillium to other genera of Trichocomaceae and studied in detail the phylogeny of the genus itself. In order to study these relationships, partial RPB1, RPB2 (RNA polymerase II genes), Tsr1 (putative ribosome biogenesis protein) and Cct8 (putative chaperonin complex component TCP-1) gene sequences were obtained. The Trichocomaceae are divided in three separate families: Aspergillaceae, Thermoascaceae and Trichocomaceae. The Aspergillaceae are characterised by the formation flask-shaped or cylindrical phialides, asci produced inside cleistothecia or surrounded by Hülle cells and mainly ascospores with a furrow or slit, while the Trichocomaceae are defined by the formation of lanceolate phialides, asci borne within a tuft or layer of loose hyphae and ascospores lacking a slit. Thermoascus and Paecilomyces, both members of Thermoascaceae, also form ascospores lacking a furrow or slit, but are differentiated from Trichocomaceae by the production of asci from croziers and their thermotolerant or thermophilic nature. Phylogenetic analysis shows that Penicillium is polyphyletic. The genus is re-defined and a monophyletic genus for both anamorphs and teleomorphs is created (Penicillium sensu stricto). The genera Thysanophora, Eupenicillium, Chromocleista, Hemicarpenteles and Torulomyces belong in Penicilliums. str. and new combinations for the species belonging to these genera are proposed. Analysis of Penicillium below genus rank revealed the presence of 25 clades. A new classification system including both anamorph and teleomorph species is proposed and these 25 clades are treated here as sections. An overview of species belonging to each section is presented.

Taxonomic novelties: New sections, all in Penicillium: sect. Sclerotiora Houbraken & Samson, sect. Charlesia Houbraken & Samson, sect. Thysanophora Houbraken & Samson,sect. Ochrosalmonea Houbraken & Samson, sect. Cinnamopurpurea Houbraken & Samson, Fracta Houbraken & Samson, sect. Stolkia Houbraken & Samson, sect. Gracilenta Houbraken & Samson, sect. Citrina Houbraken & Samson, sect. Turbata Houbraken & Samson, sect. Paradoxa Houbraken & Samson, sect. Canescentia Houbraken & Samson. New combinations:Penicillium asymmetricum (Subramanian & Sudha) Houbraken & Samson, P. bovifimosum (Tuthill & Frisvad) Houbraken & Samson, P. glaucoalbidum (Desmazières) Houbraken & Samson, P. laeve (K. Ando & Manoch) Houbraken & Samson, P. longisporum (Kendrick) Houbraken & Samson, P. malachiteum (Yaguchi & Udagawa) Houbraken & Samson, P. ovatum (K. Ando & Nawawi) Houbraken & Samson, P. parviverrucosum (K. Ando & Pitt) Houbraken & Samson, P. saturniforme (Wang & Zhuang) Houbraken & Samson, P. taiwanense (Matsushima) Houbraken & Samson. New names:Penicillium coniferophilum Houbraken & Samson, P. hennebertii Houbraken & Samson, P. melanostipe Houbraken & Samson, P. porphyreum Houbraken & Samson.

Keywords: Aspergillus; Eupenicillium; Penicillium; Talaromyces; nomenclature; taxonomy..


Figures

Fig. 1.
Fig. 1.
Best-scoring Maximum Likelihood tree using RAxML based on combined data set of partial Cct8, Tsr1, RPB1 and RPB2 sequences showing the relationship among members of Trichocomaceae. The BI posterior probabilities (pp) values and bootstrap (bs) percentages of the maximum likelihood (ML) analysis are presented at the nodes (pp/bs). Values less than 50 % supported in the ML or less than 0.90 in the Bayesian analysis are indicated with a hyphen, whereas asterisks indicate full support (100 % bs or 1.00 pp). The branches with more than 95 % bootstrap support and 1.00 posterior probability values are thickened. The bar indicates the number of substitutions per site. The tree is rooted with Coccidioides immitis (strain RS).
Fig. 1.
Fig. 1.
Best-scoring Maximum Likelihood tree using RAxML based on combined data set of partial Cct8, Tsr1, RPB1 and RPB2 sequences showing the relationship among members of Trichocomaceae. The BI posterior probabilities (pp) values and bootstrap (bs) percentages of the maximum likelihood (ML) analysis are presented at the nodes (pp/bs). Values less than 50 % supported in the ML or less than 0.90 in the Bayesian analysis are indicated with a hyphen, whereas asterisks indicate full support (100 % bs or 1.00 pp). The branches with more than 95 % bootstrap support and 1.00 posterior probability values are thickened. The bar indicates the number of substitutions per site. The tree is rooted with Coccidioides immitis (strain RS).
Fig. 7.
Fig. 7.
Best-scoring Maximum Likelihood tree using RAxML based on combined data set of partial Cct8, Tsr1, RPB1 and RPB2 sequences showing the relationship among members of Penicillium s. str. Penicillium s. str. is divided in two lineages (s/g Aspergilloides and Penicillium) and 25 sections. The BI posterior probabilities (pp) values and bootstrap (bs) percentages of the maximum likelihood (ML) analysis are presented at the nodes (bs/pp). Values less than 70 % supported in the ML or less than 0.95 in the Bayesian analysis are indicated with a hyphen, whereas asterisks indicate good support (100 % bs or 1.00 pp). The branches with more than 95 % bootstrap support and 1.00 posterior probability values are thickened. The bar indicates the number of substitutions per site. The tree is rooted with Penicillium (= Talaromyces) marneffei ATCC 18227T.
Fig. 8.
Fig. 8.
Best-scoring Maximum Likelihood tree using RAxML based on partial RPB2 sequences and giving an overview of the members accommodated in sections Aspergilloides, Sclerotiora and Charlesii. The BI posterior probabilities (pp) values and bootstrap (bs) percentages of the maximum likelihood (ML) analysis are presented at the nodes (pp/bs). Values less than 70 % supported in the ML or less than 0.95 in the Bayesian analysis are indicated with a hyphen, whereas asterisks indicate good support (100 % bs or 1.00 pp). The branches with more than 95 % bootstrap support and 1.00 posterior probability values are thickened. The bar indicates the number of substitutions per site. The tree is rooted with Talaromyces flavus CBS 310.38NT.
Fig. 10.
Fig. 10.
Best-scoring Maximum Likelihood tree using RAxML based on partial RPB2 sequences and giving an overview of the members accommodated in sections Exilicaulis, Cinnamopurpurea, Ramigena and Gracilenta. The BI posterior probabilities (pp) values and bootstrap (bs) percentages of the maximum likelihood (ML) analysis are presented at the nodes (pp/bs). Values less than 70 % supported in the ML or less than 0.95 in the Bayesian analysis are indicated with a hyphen, whereas asterisks indicate good support (100 % bs or 1.00 pp). The branches with more than 95 % bootstrap support and 1.00 posterior probability values are thickened. The bar indicates the number of substitutions per site. The tree is rooted with Talaromyces flavus CBS 310.38NT.
Fig. 11.
Fig. 11.
Best-scoring Maximum Likelihood tree using RAxML based on partial β-tubulin sequences and giving an overview of the members accommodated in sections Lanata-divaricata and Stolkia. The BI posterior probabilities (pp) values and bootstrap (bs) percentages of the maximum likelihood (ML) analysis are presented at the nodes (pp/bs). Values less than 70 % supported in the ML or less than 0.95 in the Bayesian analysis are indicated with a hyphen, whereas asterisks indicate good support (100 % bs or 1.00 pp). The branches with more than 95 % bootstrap support and 1.00 posterior probability values are thickened. The bar indicates the number of substitutions per site. The tree is rooted with Penicillium glabrum CBS 125543T.
Fig. 12.
Fig. 12.
Best-scoring Maximum Likelihood tree using RAxML based on partial RPB2 sequences and giving an overview of the members accommodated in sections Citrina and Ochrosalmonea. The BI posterior probabilities (pp) values and bootstrap (bs) percentages of the maximum likelihood (ML) analysis are presented at the nodes (pp/bs). Values less than 70 % supported in the ML or less than 0.95 in the Bayesian analysis are indicated with a hyphen, whereas asterisks indicate good support (100 % bs or 1.00 pp). The branches with more than 95 % bootstrap support and 1.00 posterior probability values are thickened. The bar indicates the number of substitutions per site. The tree is rooted with Talaromyces flavus CBS 310.38NT.
Fig. 13.
Fig. 13.
Best-scoring Maximum Likelihood tree using RAxML based on partial RPB2 sequences and giving an overview of the members accommodated in subgenus Penicillium (clades 15–25). The BI posterior probabilities (pp) values and bootstrap (bs) percentages of the maximum likelihood (ML) analysis are presented at the nodes (pp/bs). Values less than 70 % supported in the ML or less than 0.95 in the Bayesian analysis are indicated with a hyphen, whereas asterisks indicate good support (100 % bs or 1.00 pp). The branches with more than 95 % bootstrap support and 1.00 posterior probability values are thickened. The bar indicates the number of substitutions per site. The tree is rooted with Talaromyces flavus CBS 310.38NT.
Fig. 13.
Fig. 13.
Best-scoring Maximum Likelihood tree using RAxML based on partial RPB2 sequences and giving an overview of the members accommodated in subgenus Penicillium (clades 15–25). The BI posterior probabilities (pp) values and bootstrap (bs) percentages of the maximum likelihood (ML) analysis are presented at the nodes (pp/bs). Values less than 70 % supported in the ML or less than 0.95 in the Bayesian analysis are indicated with a hyphen, whereas asterisks indicate good support (100 % bs or 1.00 pp). The branches with more than 95 % bootstrap support and 1.00 posterior probability values are thickened. The bar indicates the number of substitutions per site. The tree is rooted with Talaromyces flavus CBS 310.38NT.
Fig. 2.
Fig. 2.
Phialotubus microsporus CBS 861.70isoT. A. Colonies grown for 7 d at 25 °C, from left to right: CYA, MEA, OA. B–D. Conidiophores and conidia. Scale bar = 10 μm.
Fig. 3.
Fig. 3.
Yunnania penicillata CBS 130296T. A. Colonies grown for 7 d at 25 °C, from left to right: MEA, OA, CYA. B–D. Conidiophores and conidia.
Fig. 4.
Fig. 4.
A–F. Penicillium malachiteum CBS 647.95HT. A. Colonies grown for 7 d at 25 °C, from left to right: MEA, CYA, YES, DG18. B–D. Conidiophores. E. Immature cleistothecia. F. Conidia. G–K. Penicillium sacculum CBS 123567. G. Colonies grown for 7 d at 25 °C, from left to right: MEA, CYA, YES, DG18. H–J. Conidiophores. K. Conidia. Scale bar = 10 μm.
Fig. 5.
Fig. 5.
A–G. Penicillium kewense CBS 344.61T. A. Colonies grown for 7 d at 25 °C, from left to right: MEA, CYA, YES, DG18. B–C. Cleistothecia. D-E. Conidiophores. F. Conidia. G. Ascospores. H–N. Aspergillus paradoxus (= P. paradoxum, R.A. Samson unpubl. results) CBS 130295. H. Colonies grown for 7 d at 25 °C, from left to right: MEA (14 d), CYA, YES, DG18. I. Detail of conidiophores. J. Cleistothecia. K–L. Conidiophores. M. Ascospores. N. Conidia. Scale bar = 10 μm.
Fig. 6.
Fig. 6.
A–H. Penicillium glaucoalbidum CBS 292.60. A. Colonies grown for 7 d at 25 °C, from left to right: MEA, CYA, YES, DG18. B–D. Conidiophores. E. Conidia. F–J. Penicillium lagena CBS 337.97. F. Colonies grown for 7 d at 25 °C, from left to right: MEA, CYA, YES, DG18. G–I. Conidiophores. J. Conidia. Scale bar = 10 μm.
Fig. 9.
Fig. 9.
Penicillium isariiforme CBS 247.56. A. Colonies grown for 14 d at 25 °C, from left to right: MEA, YES, CYA. B–D. Conidiophores. E. Conidia. Scale bar = 10 μm.

References

    1. Abe S. (1956). Studies on the classification of the Penicillia. The Journal of General and Applied Microbiology 2: 1–344
    1. Aguileta G, Marthey S, Chiapello H, Lebrun MH, Rodolphe F, Fournier E, Gendrault-Jacquemard A, Giraud T. (2008). Assessing the performance of single-copy genes for recovering robust phylogenies. Systematic Biology 57: 613–627 - PubMed
    1. Alfaro ME, Holder MT. (2006). The posterior and the prior in Bayesian phylogenetics. Annual Review of Ecology, Evolution, and Systematics 37: 19–42
    1. Ando K, Nawawi A, Manoch L, Pitt JI. (1998). Three new species and a new combination in the genus Torulomyces from soil. Mycoscience 39: 313–318
    1. Apinis AE. (1967). Dactylomyces and Thermoascus. Transactions of the British Mycological Society 50: 573–582

LinkOut - more resources