

Quantitative, directional measurement of electric field heterogeneity in the active site of ketosteroid isomerase
- PMID: 22308339
- PMCID: PMC3277571
- DOI: 10.1073/pnas.1111566109
Quantitative, directional measurement of electric field heterogeneity in the active site of ketosteroid isomerase
Abstract
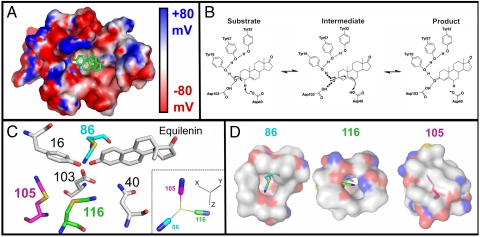
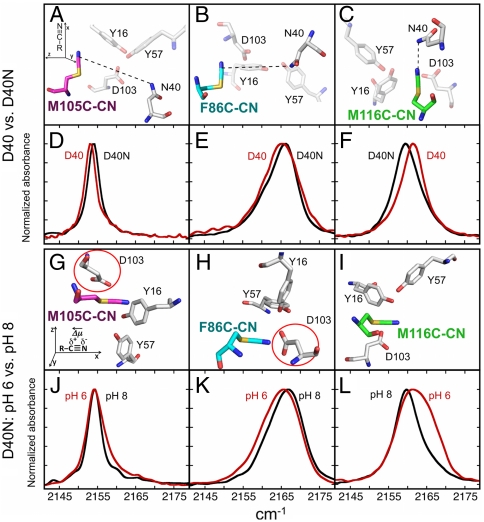
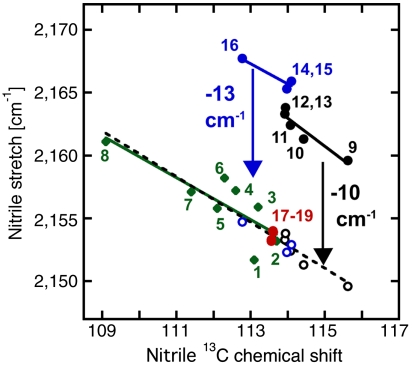
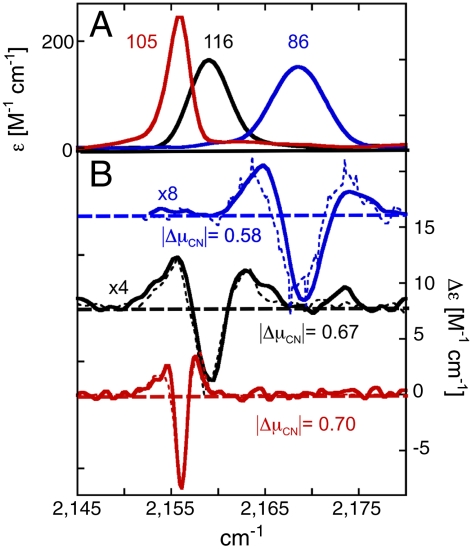
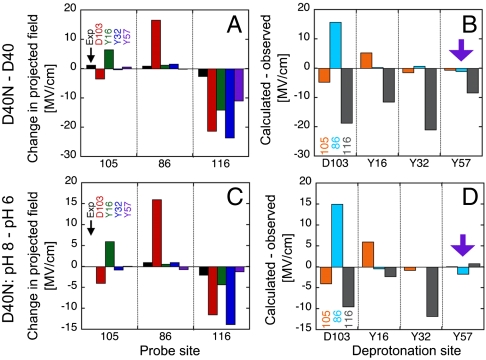
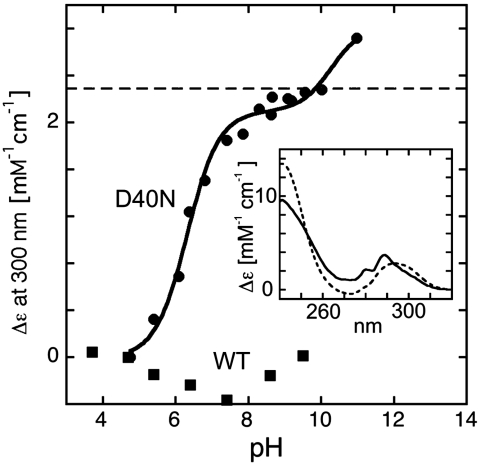
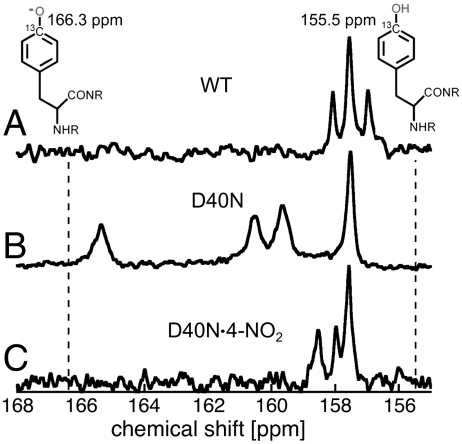
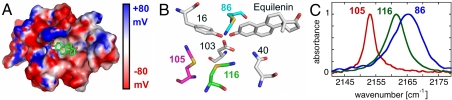
Understanding the electrostatic forces and features within highly heterogeneous, anisotropic, and chemically complex enzyme active sites and their connection to biological catalysis remains a longstanding challenge, in part due to the paucity of incisive experimental probes of electrostatic properties within proteins. To quantitatively assess the landscape of electrostatic fields at discrete locations and orientations within an enzyme active site, we have incorporated site-specific thiocyanate vibrational probes into multiple positions within bacterial ketosteroid isomerase. A battery of X-ray crystallographic, vibrational Stark spectroscopy, and NMR studies revealed electrostatic field heterogeneity of 8 MV/cm between active site probe locations and widely differing sensitivities of discrete probes to common electrostatic perturbations from mutation, ligand binding, and pH changes. Electrostatic calculations based on active site ionization states assigned by literature precedent and computational pK(a) prediction were unable to quantitatively account for the observed vibrational band shifts. However, electrostatic models of the D40N mutant gave qualitative agreement with the observed vibrational effects when an unusual ionization of an active site tyrosine with a pK(a) near 7 was included. UV-absorbance and (13)C NMR experiments confirmed the presence of a tyrosinate in the active site, in agreement with electrostatic models. This work provides the most direct measure of the heterogeneous and anisotropic nature of the electrostatic environment within an enzyme active site, and these measurements provide incisive benchmarks for further developing accurate computational models and a foundation for future tests of electrostatics in enzymatic catalysis.
Conflict of interest statement
The authors declare no conflict of interest.
Figures
Similar articles
-
Decomposition of vibrational shifts of nitriles into electrostatic and hydrogen-bonding effects.J Am Chem Soc. 2010 Sep 22;132(37):12811-3. doi: 10.1021/ja104573b. J Am Chem Soc. 2010. PMID: 20806897 Free PMC article.
-
Direct measurement of the protein response to an electrostatic perturbation that mimics the catalytic cycle in ketosteroid isomerase.Proc Natl Acad Sci U S A. 2011 Oct 4;108(40):16612-7. doi: 10.1073/pnas.1113874108. Epub 2011 Sep 26. Proc Natl Acad Sci U S A. 2011. PMID: 21949360 Free PMC article.
-
Uncovering the determinants of a highly perturbed tyrosine pKa in the active site of ketosteroid isomerase.Biochemistry. 2013 Nov 5;52(44):7840-55. doi: 10.1021/bi401083b. Epub 2013 Oct 23. Biochemistry. 2013. PMID: 24151972 Free PMC article.
-
Electric Fields and Enzyme Catalysis.Annu Rev Biochem. 2017 Jun 20;86:387-415. doi: 10.1146/annurev-biochem-061516-044432. Epub 2017 Mar 24. Annu Rev Biochem. 2017. PMID: 28375745 Free PMC article. Review.
-
Accurate Calculation of Electric Fields Inside Enzymes.Methods Enzymol. 2016;578:45-72. doi: 10.1016/bs.mie.2016.05.043. Epub 2016 Jul 1. Methods Enzymol. 2016. PMID: 27497162 Review.
Cited by
-
Minimalist IR and fluorescence probes of protein function.Curr Opin Chem Biol. 2016 Oct;34:103-109. doi: 10.1016/j.cbpa.2016.08.010. Epub 2016 Sep 10. Curr Opin Chem Biol. 2016. PMID: 27599185 Free PMC article. Review.
-
Calculations of the electric fields in liquid solutions.J Phys Chem B. 2013 Dec 19;117(50):16236-48. doi: 10.1021/jp410720y. Epub 2013 Dec 10. J Phys Chem B. 2013. PMID: 24304155 Free PMC article.
-
Picosecond-resolved fluorescent probes at functionally distinct tryptophans within a thermophilic alcohol dehydrogenase: relationship of temperature-dependent changes in fluorescence to catalysis.J Phys Chem B. 2014 Jun 12;118(23):6049-61. doi: 10.1021/jp500825x. Epub 2014 Jun 3. J Phys Chem B. 2014. PMID: 24892947 Free PMC article.
-
Calculation of vibrational shifts of nitrile probes in the active site of ketosteroid isomerase upon ligand binding.J Am Chem Soc. 2013 Jan 16;135(2):717-25. doi: 10.1021/ja3084384. Epub 2012 Dec 31. J Am Chem Soc. 2013. PMID: 23210919 Free PMC article.
-
Nitrile Infrared Intensities Characterize Electric Fields and Hydrogen Bonding in Protic, Aprotic, and Protein Environments.J Am Chem Soc. 2022 May 4;144(17):7562-7567. doi: 10.1021/jacs.2c00675. Epub 2022 Apr 25. J Am Chem Soc. 2022. PMID: 35467853 Free PMC article.
References
-
- Selzer T, Schreiber G. Predicting the rate enhancement of protein complex formation from the electrostatic energy of interaction. J Mol Biol. 1999;287:409–419. - PubMed
-
- Lee L-P, Tidor B. Barstar is electrostatically optimized for tight binding to barnase. Nat Struct Mol Biol. 2001;8:73–76. - PubMed
-
- Getzoff ED, et al. Faster superoxide dismutase mutants designed by enhancing electrostatic guidance. Nature. 1992;358:347–351. - PubMed
-
- Dong F, Zhou H. Electrostatic contribution to the binding stability of protein-protein complexes. Proteins. 2006;65:87–102. - PubMed
Publication types
MeSH terms
Substances
Associated data
- Actions
- Actions
- Actions
- Actions
Grants and funding
LinkOut - more resources
Full Text Sources
Other Literature Sources
