. 2012 Mar 20;109(12):E715-24.
doi: 10.1073/pnas.1111600109. Epub 2012 Jan 17.

Diabetes promotes an inflammatory macrophage phenotype and atherosclerosis through acyl-CoA synthetase 1

Affiliations

Diabetes promotes an inflammatory macrophage phenotype and atherosclerosis through acyl-CoA synthetase 1

Jenny E Kanter et al. Proc Natl Acad Sci U S A. .

Abstract

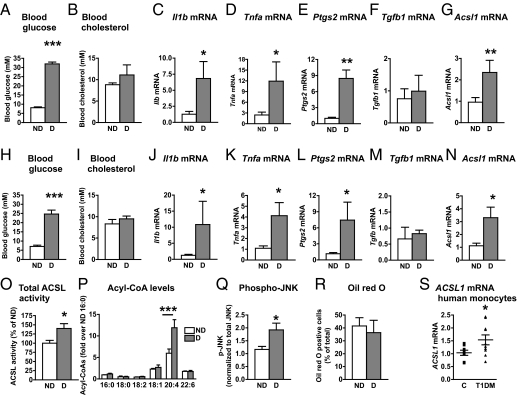
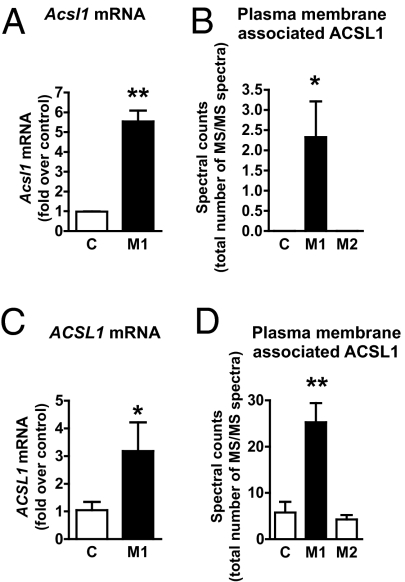
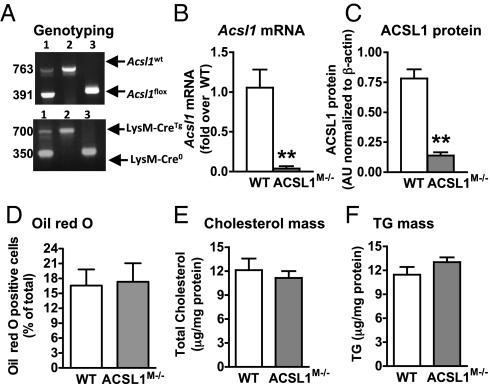
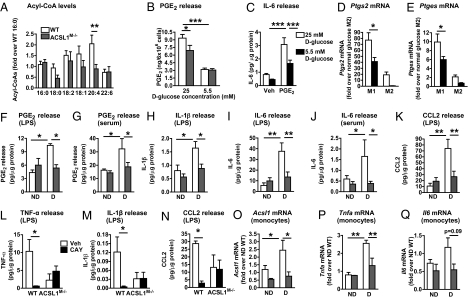
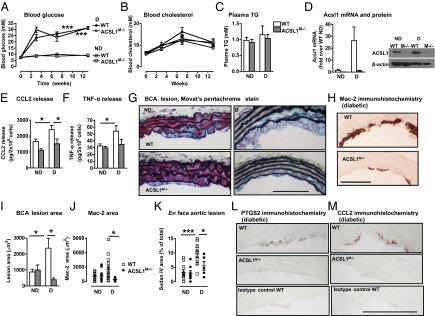
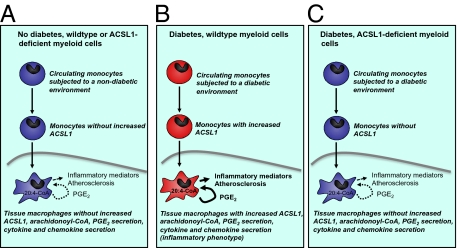
The mechanisms that promote an inflammatory environment and accelerated atherosclerosis in diabetes are poorly understood. We show that macrophages isolated from two different mouse models of type 1 diabetes exhibit an inflammatory phenotype. This inflammatory phenotype associates with increased expression of long-chain acyl-CoA synthetase 1 (ACSL1), an enzyme that catalyzes the thioesterification of fatty acids. Monocytes from humans and mice with type 1 diabetes also exhibit increased ACSL1. Furthermore, myeloid-selective deletion of ACSL1 protects monocytes and macrophages from the inflammatory effects of diabetes. Strikingly, myeloid-selective deletion of ACSL1 also prevents accelerated atherosclerosis in diabetic mice without affecting lesions in nondiabetic mice. Our observations indicate that ACSL1 plays a critical role by promoting the inflammatory phenotype of macrophages associated with type 1 diabetes; they also raise the possibilities that diabetic atherosclerosis has an etiology that is, at least in part, distinct from the etiology of nondiabetic vascular disease and that this difference is because of increased monocyte and macrophage ACSL1 expression.


Conflict of interest statement

The authors declare no conflict of interest.

Figures

Fig. 1.
Fig. 1.
Diabetes promotes an inflammatory macrophage phenotype characterized by increased ACSL1 expression. (A–G, O, and R) LDLR−/−;GP+ (n = 5–7) mice were injected with LCMV or saline; alternatively (H–N, P, and Q), LDLR−/−;GP+ mice (n = 6–9) were injected with streptozotocin (STZ) or citrate buffer (control). All mice were maintained on a low-fat diet for 4 wk after the onset of diabetes. At the end of 4 wk, blood glucose (A and H) and blood cholesterol (B and I) were measured, and peritoneal macrophages were harvested by lavage. Real-time qPCR was used to determine abundance of pro- and antiinflammatory markers. (C and J) Il1b mRNA, (D and K) Tnfa mRNA, (E and L) Ptgs2 mRNA, (F and M) Tgfb1 mRNA, and (G and N) Acsl1 mRNA. Similar results were obtained from thioglycollate-elicited and resident macrophages. (O) Total ACSL enzymatic activity measured as the rate of conversion of [3H]-18:1 to [3H]-18:1-CoA in thioglycollate-elicited macrophages. (P) Acyl-CoA species measured by LC-ESI-MS/MS. (Q) Phospho-JNK levels were measured by Western blot and normalized to total levels of JNK in thioglycollate-elicited macrophages (n = 4–5). (R) Oil red O staining of thioglycollate-elicited macrophages. (S) CD14+ monocytes were isolated from human subjects with type 1 diabetes or age-matched controls. ACSL1 mRNA was measured by real-time qPCR (n = 8–9). The results are expressed as mean + SEM or scatter plots. *P < 0.05, **P < 0.01, and ***P < 0.001 by unpaired Student t test compared with nondiabetic controls. Levels of mRNA are expressed as fold-over nondiabetic controls. When statistically justified, mRNA levels were log-transformed before statistical analysis was performed. ND, nondiabetic mice; D, diabetic mice; T1DM, human subjects with type 1 diabetes mellitus; C, control.
Fig. 2.
Fig. 2.
ACSL1 is markedly increased in inflammatory macrophages. Mouse BMDMs from WT mice were activated using LPS/IFN-γ (for M1 polarization) or IL-4 (for M2 polarization) or were left as unactivated controls for 48 h. (A) Acsl mRNA levels were measured by real-time qPCR. (B) Plasma membranes isolated from biotin-labeled M1 and M2 macrophages and unactivated macrophages (controls) were subjected to LC-MS/MS. The spectral counts represent the total number of ACSL1-derived peptides identified (n = 6). (C) Human monocyte-derived macrophages were differentiated in the presence of M-CSF and then activated with LPS/IFN-γ (M1) or left unactivated (control). ACSL1 mRNA was measured by real-time qPCR (n = 3–5). (D). Membrane-associated ACSL1 in human monocyte-derived macrophages was measured by Western blot or LC-MS/MS as described for mouse BMDMs. The results are expressed as mean + SEM (n = 3 unless otherwise noted). *P < 0.05 and **P < 0.01 by unpaired Student t test. C, control.
Fig. 3.
Fig. 3.
Generation of a myeloid-selective ACSL1-deficient mouse model. (A) Acsl1 PCR yields a 763-bp band for the WT Acsl1 allele and a 319-bp band for the LoxP allele (Upper). LysM-Cre recombinase PCR yields a 350-bp band for the WT allele and a 700-bp band for the LysM Cre-recombinase allele. (B) Loss of Acsl1 mRNA in thioglycollate-elicited macrophages from ACSL1M−/− mice. (C) Reduced ACSL1 protein levels in thioglycollate-elicited peritoneal macrophages from ACSL1M−/− mice. (D–F) Thioglycollate-elicited macrophages from LDLR−/− mice (n = 7–10) transplanted with bone marrow from WT or ACSL1M−/− mice were stained with Oil red O for neutral lipids (D) or used to quantify total cellular cholesterol (E) and total cellular triacylglycerol (F). The results are expressed as mean + SEM (n = 3 unless otherwise noted). **P < 0.01 by unpaired Student t test (B and C). TG, triacylglycerol.
Fig. 4.
Fig. 4.
ACSL1 deficiency inhibits arachidonoyl-CoA synthesis and levels of inflammatory PGE2, cytokines, and chemokines in macrophages. (A) Acyl-CoA levels in thioglycollate-elicited macrophages were measured by LC-ESI-MS/MS (n = 8). (B) Levels of 20:4-derived PGE2 (n = 4–5). (C) IL-6 release, measured by ELISA, from unactivated BMDMs differentiated in the presence or absence (control vehicle) or 5 μM PGE2 and 25 or 5 mM d-glucose (n = 3). (D and E) Ptgs2 and Ptges levels in WT M1 and M2 BMDMs under normal (5.5 mM) and high (25 mM)-glucose conditions were measured by real-time qPCR (n = 3). (F–K) Diabetes was induced in WT and ACSL1M−/− mice by streptozotocin (n = 3–5). After 4 wk of diabetes, thioglycollate-elicited macrophages were isolated, adhesion-purified for 1 h, and then incubated in the presence of 5 ng/mL LPS or 5% autologous serum for 6 h as indicated, or WT and ACSL1M−/− macrophages from diabetic mice were incubated in the presence of the PTGS2 inhibitor CAY10404 (500 nM) or vehicle (L–N). PGE2 release (F and G), IL-1β release (H and M), IL-6 release (I and J), CCL2 release (K and N), and TNF-α release (L) were measured by ELISA. IL-1β and CCL2 release from serum-stimulated cells was below detection or 100-fold lower than in LPS-stimulated cells. (O–Q) Freshly isolated nonstimulated monocytes were isolated from blood of nondiabetic and diabetic WT and ACSL1M−/− mice after 4 wk of induction of diabetes with streptozotocin. Acsl1 (O), Tnfa (P), and Il6 (Q) mRNA was measured by real-time PCR. The results are expressed as mean + SEM (n = 3–4 unless otherwise noted). *P < 0.05, **P < 0.01, and ***P < 0.001; ANOVA.
Fig. 5.
Fig. 5.
Myeloid ACSL1 deficiency protects against the diabetes-induced macrophage inflammatory phenotype and atherosclerosis. Female LDLR−/−;GP+ mice (12–14 wk) were bone marrow-transplanted with bone marrow from WT or ACSL1M−/− mice. After a 3- to 7-wk recovery period, diabetes was induced. The mice were maintained on a low-fat diet after the onset of diabetes. Blood glucose (A) and cholesterol (B) were monitored at indicated time points, and plasma TG (C) was measured at the end of the 12-wk study (n = 8–15). A subset (n = 5–7) of mice was euthanized after 4 wk of diabetes, and thioglycollate-elicited peritoneal macrophages were harvested by lavage. Real-time qPCR was used to determine abundance of (D) Acsl1 mRNA, and Western blot was used to detect ACSL1 protein. ELISAs were used to determine levels of secreted CCL2 (E) and TNF-α (F) in the media after a 6-h incubation. After 12 wk of diabetes, the entire BCA was serial-sectioned. (G) Examples of Movat's pentachrome-stained cross-sections of the BCA. (H) Sections from diabetic animals stained using an anti–Mac-2 antibody. (I) The macrophage-rich lesion area was analyzed over three slides at the site of maximal lesion size for each mouse. (J) Quantification of Mac-2–positive lesion BCA area. (K) The aorta was opened longitudinally, the aortic arch was stained using Sudan IV, and the Sudan IV-positive lesion area was quantified by Image J. (L) Immunohistochemistry showing PTGS2 immunoreactivity in lesions from diabetic mice and an isotype-matched negative control antibody. (M) Immunohistochemistry showing CCL2 immunoreactivity in lesions from diabetic mice. The results are expressed as mean + SEM. *P < 0.05 and ***P < 0.001 by one-way ANOVA. (Scale bar: 100 μm.) The results are shown as mean + or ± SEM. *P < 0.05 and ***P < 0.001 by one-way ANOVA or Student t test (F).
Fig. P1.
Fig. P1.
(A) Under nondiabetic conditions, myeloid ACSL1 expression is not induced, and tissue macrophages do not secrete increased levels of inflammatory mediators. (B) Under diabetic conditions, circulating myeloid cells are exposed to the diabetic environment, exhibit an increased ACSL1 expression, and take on a more inflammatory phenotype. Concomitantly, there is an increased synthesis of arachidonoyl-CoA (20:4-CoA), secretion of PGE2, and number of inflammatory cytokines and chemokines from tissue macrophages as well as increased atherosclerosis compared with the nondiabetic condition. (C) Myeloid ACSL1 deficiency in the setting of diabetes prevents the increased arachidonoyl-CoA levels and the inflammatory phenotype of tissue macrophages and diabetes-accelerated atherosclerosis. Blue cells, noninflammatory phenotype; red cells, inflammatory phenotype.

Comment in

Similar articles

Cited by

References

    1. Devaraj S, et al. Increased monocytic activity and biomarkers of inflammation in patients with type 1 diabetes. Diabetes. 2006;55:774–779. - PubMed
    1. Bradshaw EM, et al. Monocytes from patients with type 1 diabetes spontaneously secrete proinflammatory cytokines inducing Th17 cells. J Immunol. 2009;183:4432–4439. - PMC - PubMed
    1. Litherland SA, et al. Aberrant prostaglandin synthase 2 expression defines an antigen-presenting cell defect for insulin-dependent diabetes mellitus. J Clin Invest. 1999;104:515–523. - PMC - PubMed
    1. Shanmugam N, Gaw Gonzalo IT, Natarajan R. Molecular mechanisms of high glucose-induced cyclooxygenase-2 expression in monocytes. Diabetes. 2004;53:795–802. - PubMed
    1. Natarajan R, Nadler JL. Lipid inflammatory mediators in diabetic vascular disease. Arterioscler Thromb Vasc Biol. 2004;24:1542–1548. - PubMed

Publication types