. 2012 Feb 14;109(7):2228-33.
doi: 10.1073/pnas.1113729109. Epub 2012 Jan 30.

Near-infrared fluorescent sensor for in vivo copper imaging in a murine Wilson disease model

Affiliations

Near-infrared fluorescent sensor for in vivo copper imaging in a murine Wilson disease model

Tasuku Hirayama et al. Proc Natl Acad Sci U S A. .

Abstract

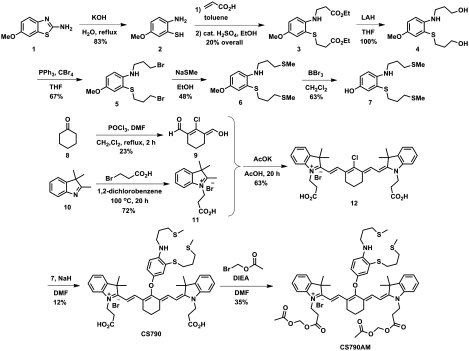
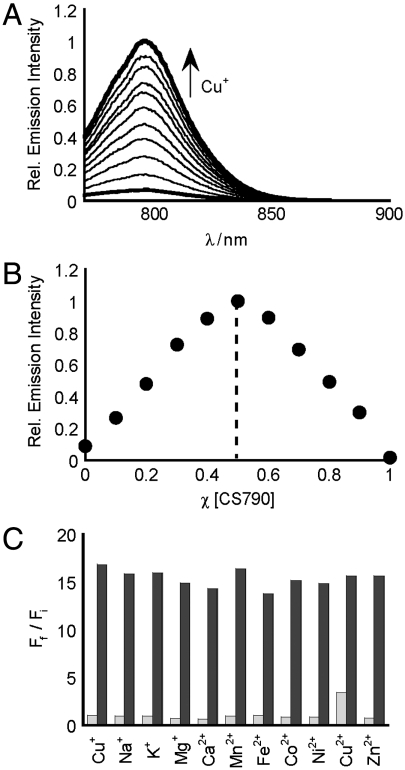
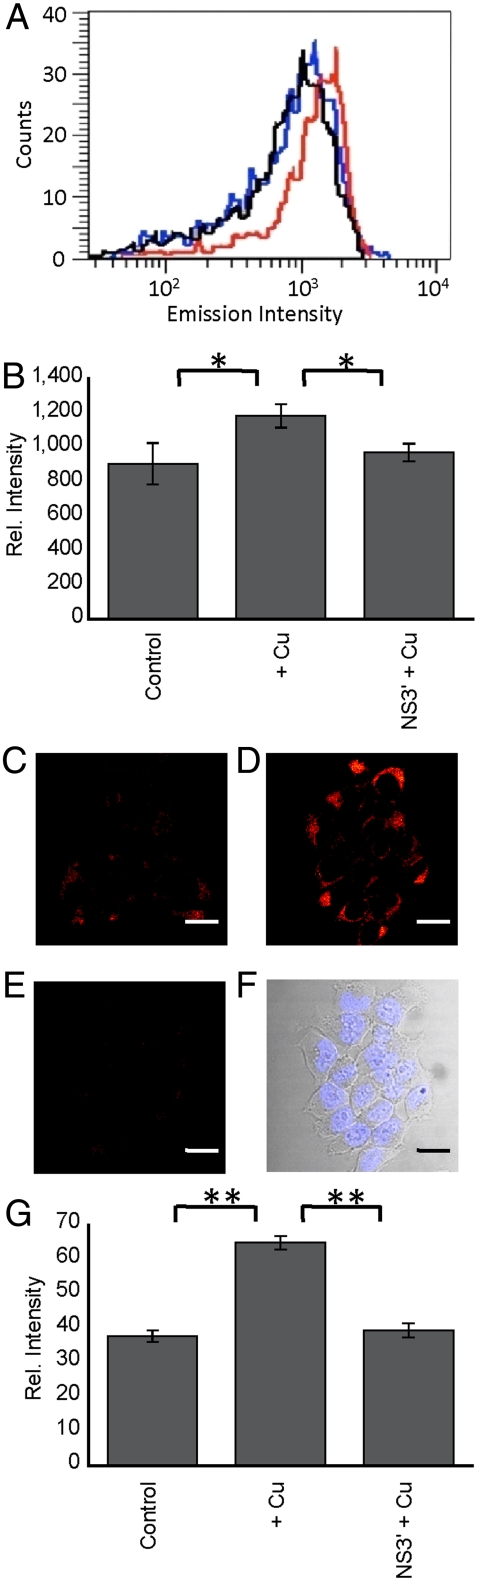
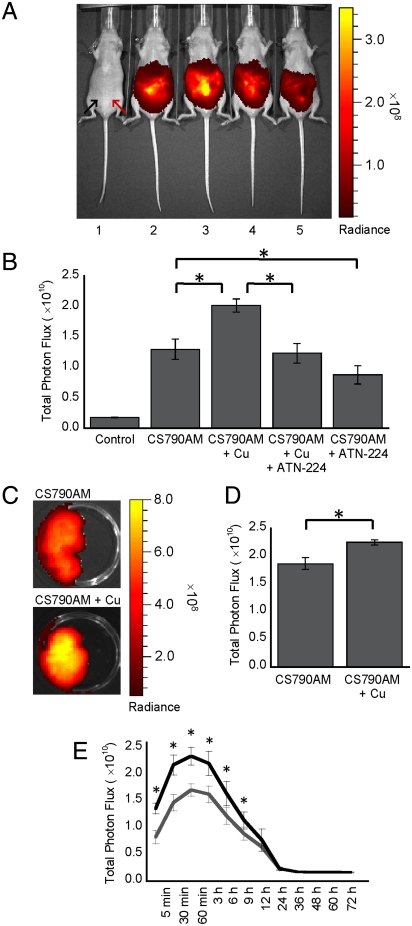
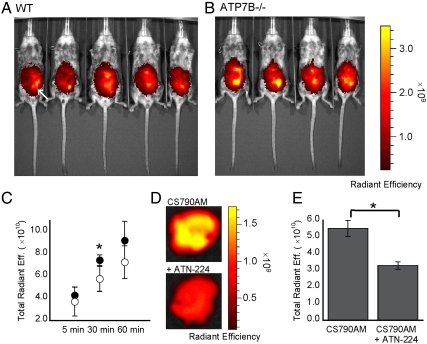
Copper is an essential metal nutrient that is tightly regulated in the body because loss of its homeostasis is connected to severe diseases such as Menkes and Wilson diseases, Alzheimer's disease, prion disorders, and amyotrophic lateral sclerosis. The complex relationships between copper status and various stages of health and disease remain challenging to elucidate, in part due to a lack of methods for monitoring dynamic changes in copper pools in whole living organisms. Here we present the synthesis, spectroscopy, and in vivo imaging applications of Coppersensor 790, a first-generation fluorescent sensor for visualizing labile copper pools in living animals. Coppersensor 790 combines a near-infrared emitting cyanine dye with a sulfur-rich receptor to provide a selective and sensitive turn-on response to copper. This probe is capable of monitoring fluctuations in exchangeable copper stores in living cells and mice under basal conditions, as well as in situations of copper overload or deficiency. Moreover, we demonstrate the utility of this unique chemical tool to detect aberrant increases in labile copper levels in a murine model of Wilson disease, a genetic disorder that is characterized by accumulation of excess copper. The ability to monitor real-time copper fluxes in living animals offers potentially rich opportunities to examine copper physiology in health and disease.


Conflict of interest statement

The authors declare no conflict of interest.

Figures

Fig. 1.
Fig. 1.
Synthesis of Coppersensor 790 (CS790) and Coppersensor 790 Acetoxymethyl Ester (CS790AM).
Fig. 2.
Fig. 2.
Spectroscopic characterization of CS790. All spectra were acquired in 20 mM Hepes, pH 7.0, at 25 °C. (A) Fluorescence response of 2 μM CS790 to 0–2 μM Cu+. Spectra shown are for [Cu+] of 0, 0.2, 0.4, 0.6, 0.8, 1.0, 1.2, 1.4, 1.6, 1.8, and 2.0 μM. (B) Job’s plot of CS790 and Cu+. The total concentration of CS790C and Cu+ were kept at 2 μM, and spectra were acquired using a λex of 760 nm and a λem of 790 nm. (C) Fluorescence responses of CS790 to various metal ions. Bars represent the final integrated fluorescence response (Ff) over the initial integrated emission (Fi). Light-gray bars represent the addition of an excess of the indicated metal ion (2 mM for Ca2+, Mg2+, and Zn2+; 20 μM for all other cations) to a 2 μM solution of CS790. Dark-gray bars represent subsequent addition of 2 μM Cu+ to the solution. Excitation was provided at 760 nm and emission was recorded at 790 nm.
Fig. 3.
Fig. 3.
Molecular imaging of Cu+ in HEK 293T cells. (A) Flow cytometry histograms for control cells (black), cells treated with 100 μM CuCl2 for 12 h (red), and cells treated with 100 μM CuCl2 for 12 h and 100 μM NS3′ (blue). For all conditions in A, cells were incubated with 2 μM CS790AM and NS3′ or vehicle for 15 min at 37 °C. (B) Graph showing quantification of mean fluorescence intensity of each condition shown in A, normalized to the control condition. (CF) Confocal images of control cells (C), cells treated with 100 μM CuCl2 for 12 h (D), cells treated with 100 μM CuCl2 for 12 h and 100 μM NS3′ (E), and brightfield image of cells overlayed with the nuclear Hoechst 33342 stain, indicating cellular viability (F). CE were stained with 2 μM CS790AM, 1 μM Hoechst 33342, and NS3′ or vehicle for 15 min at 37 °C. (Scale bar: 20 μm.) (G) Graph showing quantification of mean fluorescence intensity of each condition (CF), normalized to the control condition. Statistical analyses were performed with a two-tailed Student’s t-test. *P < 0.05 (n = 3), **P < 0.001 (n = 3). and error bars are ± SD.
Fig. 4.
Fig. 4.
CS790AM studies in SKH-1 mice. (A) Representative image of mice injected i.p. with vehicle, CS790AM (0.1 mM, 50 μL in 7∶3 DMSO∶PBS), CuCl2 (5 mg/kg in 50 μL of PBS), and/or ATN-224 (5 mg/kg in 50 μL PBS). From left to right: vehicles only; vehicles and CS790AM; CuCl2, vehicle, and CS790AM; CuCl2, ATN-224, and CS790AM; vehicle, ATN-224, and CS790AM. For all mice, CuCl2, ATN-224, or vehicle was injected 2 h prior to CS790AM or vehicle. Images were collected 5 min after CS790AM injection. Black arrow indicates injection location for CuCl2, ATN-224, or vehicle; red arrow indicates injection location for CS790AM or vehicle. (B) Total photon flux from each mouse, 5 min after CS790AM injection. (C) Representative images of livers from SKH-1 mice injected i.p. with CuCl2 or PBS, as described above, 2 h prior to CS790AM. (D) Total photon flux from imaged livers. (E) Fluorescence curves over 72 h for mice injected i.p. with CuCl2 (black line) or PBS (gray line), as described above, 2 h prior to CS790AM. Statistical analyses were performed with a two-tailed Student’s t-test. *P < 0.05 [n = 3 (B and D), n = 4 (E)] and error bars are ± SD.
Fig. 5.
Fig. 5.
CS790AM studies in Atp7b-/- mice. (A and B) Images of WT (A) and Atp7b-/- (B) mice 30 min after injection of CS790AM (0.1 mM, 50 μL in 7∶3 DMSO : PBS). White arrow indicates location of CS790AM injection site. (C) Plot of total fluorescent signal from Atp7b-/- mice (black circles) and WT mice (white circles) 5, 30, and 60 min after CS790AM injection. (D) Representative images of livers from Atp7b-/- mice injected with PBS (i.p., 50 μL, Upper) or ATN-224 (i.p., 5 mg/kg in 50 μL PBS, Lower) 2 h prior to CS790AM. (E) Total photon flux from imaged livers. Statistical analyses were performed with a two-tailed Student’s t-test. *P < 0.05 [n = 5 (A), n = 4 (B), n = 2 (D)] and error bars are ± SD.

References

    1. Lippard S, Berg JM. Principles of Bioinorganic Chemistry. Mill Valley, CA: University Science Books; 1994.
    1. Gray H, Stiefel EI, Valentine JS, Bertini I. Biological Inorganic Chemistry: Structure and Reactivity. Mill Valley, CA: University Science Books; 2007.
    1. Prohaska J, Gybina AA. Intracellular copper transport in mammals. J Nutr. 2004;134:1003–1006. - PubMed
    1. Que E, Domaille DW, Chang CJ. Metals in neurobiology: Probing their chemistry and biology with molecular imaging. Chem Rev. 2008;108:1517–1549. - PubMed
    1. Thiele DJ, Gitlin JD. Assembling the pieces. Nat Chem Biol. 2008;4:145–147. - PMC - PubMed

Publication types