. 2012 Apr 17;109(16):E972-80.
doi: 10.1073/pnas.1115685109. Epub 2012 Jan 31.

Hierarchical processing of complex motion along the primate dorsal visual pathway

Affiliations

Hierarchical processing of complex motion along the primate dorsal visual pathway

Patrick J Mineault et al. Proc Natl Acad Sci U S A. .

Abstract

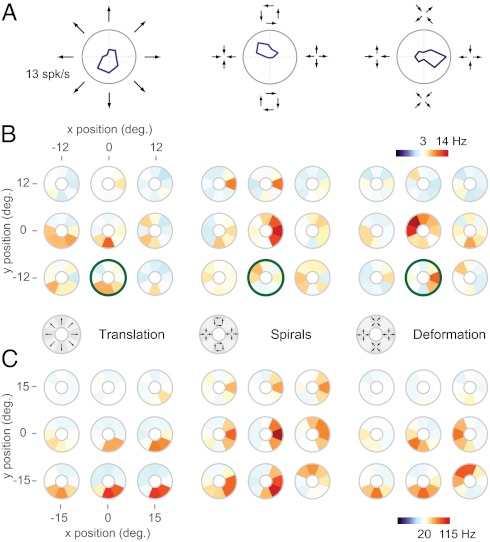
Neurons in the medial superior temporal (MST) area of the primate visual cortex respond selectively to complex motion patterns defined by expansion, rotation, and deformation. Consequently they are often hypothesized to be involved in important behavioral functions, such as encoding the velocities of moving objects and surfaces relative to the observer. However, the computations underlying such selectivity are unknown. In this work we have developed a unique, naturalistic motion stimulus and used it to probe the complex selectivity of MST neurons. The resulting data were then used to estimate the properties of the feed-forward inputs to each neuron. This analysis yielded models that successfully accounted for much of the observed stimulus selectivity, provided that the inputs were combined via a nonlinear integration mechanism that approximates a multiplicative interaction among MST inputs. In simulations we found that this type of integration has the functional role of improving estimates of the 3D velocity of moving objects. As this computation is of general utility for detecting complex stimulus features, we suggest that it may represent a fundamental aspect of hierarchical sensory processing.


Conflict of interest statement

The authors declare no conflict of interest.

Figures

Fig. 1.
Fig. 1.
Tuning of MST neurons for complex optic flow. (A) Tuning curves for a single MST neuron to visual motion composed of translation (Left), spirals (Center), and deformation (Right). Stimuli were presented at one position on a 3 × 3 grid centered on the fovea. (B) Tuning mosaics, in which large responses are represented by red colors, small responses by blue, and median responses by white. Each mosaic captures the tuning for one of the stimulus types shown in A at nine positions in the visual field. The mosaics highlighted in green correspond to the tuning curves shown in A. This cell consistently preferred downward translation (Left) and tuning for spirals (Center) and deformation (Right) varied across positions. (C) Tuning mosaics for a second example cell. This cell consistently preferred downward translation (Left) and expansion (Center) at most spatial positions.
Fig. 2.
Fig. 2.
Performance of the linear hierarchical model. (A) The stimulus was processed by groups of MT-like filters (only two groups shown for clarity), which could vary in preferred direction, spatial position, and speed. The outputs of these filters were weighted, summed, and nonlinearly transduced to a firing rate. (B) Predicted tuning mosaics for the same cell as in Fig. 1B under the hierarchical model. The hierarchical model correctly captures the optic flow tuning of this cell, including the preferences for spiral motion (Center). (C) Same as in B but for the example cell shown in Fig. 1C. The hierarchical model fails to capture this cell's tuning to complex optic flow (spirals and deformations).
Fig. 3.
Fig. 3.
Performance of the hierarchical model with nonlinear integration. (A) The stimulus was processed by groups of MT-like filters. The output of these filters was passed through a nonlinearity and then weighted, summed, and transduced to a firing rate. For each MST cell, the nonlinearity could vary from compressive to expansive and was identical across all subunits. (B) Predicted tuning mosaics for the same cell as in Fig. 1C under the nonlinear integration model. This model accurately captures the tuning and relative response levels of this cell to translation and spirals. (C) Quality of tuning curve predictions for the hierarchical model with and without nonlinear integration. The nonlinear integration model improves performance in 75% of the tested cells.
Fig. 4.
Fig. 4.
Diversity of receptive field substructures in MST. (A) Receptive field substructure for the example cell shown in Fig. 1C. This visualization was produced by constructing a compact representation of the subunits in the nonlinear integration model. Red represents excitatory input, blue inhibitory input, opacity the magnitude of the weight of the subunit, and the direction of the arrow the preferred direction of the subunit. This cell's tuning for downward motion and expansion is explained by downward-left–tuned subunits in the lower left portion of the visual field and downward-right–tuned subunits in the lower right. (B) Substructure of example cell shown in Fig. 1B. This cell's receptive field was composed of a single, downward-left–tuned subunit. (C–E) The most critical subunits for three expansion-tuned cells. Whereas these cells and the one presented in Fig. 5A can all be described as expansion tuned, they show a diversity of receptive field arrangements. (F) Histogram of number of subunits found by the visualization procedure.
Fig. 5.
Fig. 5.
Analysis of optimal subunit nonlinearity across the MST population. (A) In the nonlinear integration model, subunit outputs were processed by a nonlinearity of the form f(x) = max(0, x)β. β values <1 correspond to a compressive nonlinearity, whereas values >1 indicate an expansive nonlinearity. Most MST cells required a compressive nonlinearity at the level of each subunit. (B) In the divisive surround model, the output of the center of subunits is divided by the output of a pool of subunits differing in tuning bandwidth and spatial extent. A strongly tuned divisive surround with small spatial extent is equivalent to a static compressive nonlinearity.
Fig. 6.
Fig. 6.
Role of nonlinear integration revealed by population decoding. (A) In a decoding simulation, stimuli were processed by a population of MST model cells estimated from the recorded data. The goal of the linear decoder (Top) was to deduce physical parameters of the stimulus on the basis of the output of the MST population. (B) Example stimuli used in the object-decoding simulation corresponding to motion of an object in three dimensions. (C) Performance of the decoder based on input from the hierarchical model population with (black bars) and without (gray bars) nonlinear integration. Results are quantified as the mean error relative to the range tested; smaller values indicate better performance. Error bars indicate 1 SD from the mean, determined through a resampling procedure (Methods). The sensitivity of the nonlinear integration mechanisms to combinations of inputs facilitates the decoding of object velocity on the basis of the output of the MST population.
Fig P1.
Fig P1.
(A) MST model. The stimulus was processed by groups of MT-like filters, which varied in preferred direction, spatial position, and speed. The output of each filter was passed through a nonlinearity and then weighted, summed, and transduced to a firing rate. (B) Example receptive field. This cell preferred downward motion and expansion in a variety of different locations in its receptive field. These preferences were best captured by the nonlinear integration model in A with a strongly compressive nonlinearity.

Similar articles

Cited by

References

    1. Hubel DH, Wiesel TN. Receptive fields, binocular interaction and functional architecture in the cat's visual cortex. J Physiol. 1962;160:106–154. - PMC - PubMed
    1. DeAngelis GC, Ohzawa I, Freeman RD. Spatiotemporal organization of simple-cell receptive fields in the cat's striate cortex. II. Linearity of temporal and spatial summation. J Neurophysiol. 1993;69:1118–1135. - PubMed
    1. Movshon JA, Thompson ID, Tolhurst DJ. Receptive field organization of complex cells in the cat's striate cortex. J Physiol. 1978;283:79–99. - PMC - PubMed
    1. Pasupathy A, Connor CE. Shape representation in area V4: Position-specific tuning for boundary conformation. J Neurophysiol. 2001;86:2505–2519. - PubMed
    1. Brincat SL, Connor CE. Underlying principles of visual shape selectivity in posterior inferotemporal cortex. Nat Neurosci. 2004;7:880–886. - PubMed

Publication types