. 2012 Feb 21;109(8):2908-12.
doi: 10.1073/pnas.1115743109. Epub 2012 Feb 2.

Structure of saposin A lipoprotein discs

Affiliations

Structure of saposin A lipoprotein discs

Konstantin Popovic et al. Proc Natl Acad Sci U S A. .

Abstract

The saposins are small, membrane-active proteins that exist in both soluble and lipid-bound states. Saposin A has roles in sphingolipid catabolism and transport and is required for the breakdown of galactosylceramide by β-galactosylceramidase. In the absence of lipid, saposin A adopts a closed monomeric apo conformation typical of this family. To study a lipid-bound state of this protein, we determined the crystal structure of saposin A in the presence of detergent to 1.9 Å resolution. The structure reveals two chains of saposin A in an open conformation encapsulating 40 internally bound detergent molecules organized in a highly ordered bilayer-like hydrophobic core. The complex provides a high-resolution view of a discoidal lipoprotein particle in which all of the internalized acyl chains are resolved. Saposin A lipoprotein discs exhibit limited selectivity with respect to the incorporated lipid, and can solubilize phospholipids, sphingolipids, and cholesterol into discrete, monodisperse particles with mass of approximately 27 kDa. These discs may be the smallest possible lipoprotein structures that are stabilized by lipid self-assembly.


Conflict of interest statement

The authors declare no conflict of interest.

Figures

Fig. 1.
Fig. 1.
Solution characterization of saposin A in the presence of lipids and detergent. (A) Emission spectra of saposin A in the absence of lipid or detergent (blue), in the presence of a lipid mix designed to mimic lysosomal lipids (PC∶Chol∶BMP∶GalCer 50∶25∶20∶5, lipid mix) (black), PC liposomes (red), or LDAO detergent (green). (B) SEC of saposin A in the absence of lipid (blue), after incubation with a 10-fold molar excess of lipid mix (black) or 10-fold molar excess of egg PC liposomes (red). Size standards are indicated above the elution profiles in hydrodynamic radii (nanometers) and mass (kilodalton). (C) Size distribution of the pooled and concentrated fractions corresponding to the peak at approximately 15 mls with the lipid mix in B as measured by DLS. (D) SEC elution profiles from a 10∶1 lipid mix∶saposin A solution at 280 nm (black) and for an equivalent mix in which the GalCer is replaced with TopFluor-GalCer and absorption monitored at 490 nm (purple).
Fig. 2.
Fig. 2.
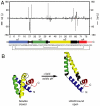
Conformational analysis of saposin A in the closed form [soluble apo; Protein Data Bank (PDB) ID code 2DOB] compared to the open form (LDAO complex, this work). (A) Differences in the main chain torsion angles between the apo and LDAO complexes. The residues with significant conformational changes are shown in black in the secondary structure schematic of the protein. The thin lines connecting cysteine residues represent disulfide bonds. (B) Ribbon diagram of the two forms, with the stem region (helices α1 and α4) in the same orientation in both views. Coloring as in A.
Fig. 3.
Fig. 3.
Crystal structure of saposin A in complex with LDAO. (A) Three views of the half dimer seen in the crystal asymmetric unit. Saposin A is shown in blue ribbons with the 20 LDAO molecules rendered with red oxygens, dark blue nitrogens, and green carbons. (B) Surface representations of the open form of saposin A from the crystal structure showing the apolar concave surface and polar convex surface. Carbons are colored white. The detergent molecules are not included in this representation.
Fig. 4.
Fig. 4.
Structure of the saposin A/LDAO lipoprotein discs. (A) Side view of the complex. (B) View from the top of the dimer (relative to A). (C) View from the bottom of the dimer. The LDAO head groups are represented by gray spheres. (D) Assembly of the 40 LDAO molecules from the dimer. The view is similar to the view as in A, but without the protein. (E) A thin slab in the region of the C8 atoms of the upper LDAO leaflet reveals a pseudohexagonal lattice involving 18 detergent molecules. The two saposin A monomers are represented as red and blue surfaces, and the detergent molecules are shown in stick representation with dotted van der Waals surfaces. Green lines connect the detergent pseudoatomic positions in the projection.
Fig. 5.
Fig. 5.
Differences in the environment of the aromatic residues in helix α2. (A) Residues Phe30 and Trp37 (black) are solvent exposed in the apo form of saposin A. (B) The side chains are buried in the LDAO head group/acyl chain interface region in the complex. This view is from the same perspective as in Fig. 4B.
Fig. 6.
Fig. 6.
Structural features of a POPC containing saposin A-lipid disc from coarse-grained simulations. (A) The saposin A crystal structure is shown in ribbon representation superimposed over the spatial distribution of the protein from the simulations (wire mesh). Top view of the disc. (B) Side view of the saposin A-lipid disc from the simulations. The protein spatial distribution is shown in solid blue surface, the POPC tails are in solid green surface, and the POPC choline head group distribution is in gray wire frame. (C) Snapshot of a representative structure from the coarse-grained simulation. The choline head group of the lipid is represented by a black bead, and the acyl chains of the two POPC leaflets are colored in different shades of green. The molecular surface of one of the saposin A chains is shown in blue. The frontmost saposin A chain is omitted to reveal the lipidic core of the complex. (D) Leaflet distribution of POPC molecules shown by the time series histogram of the number of POPC molecules in the upper (Nupper) and lower (Nlower) leaflet in the 33 representative simulations.

Similar articles

Cited by

References

    1. Kolter T, Sandhoff K. Lysosomal degradation of membrane lipids. FEBS Lett. 2010;584:1700–1712. - PubMed
    1. Wendeler M, et al. Photoaffinity labelling of the human GM2-activator protein. Mechanistic insight into ganglioside GM2 degradation. Eur J Biochem. 2004;271:614–627. - PubMed
    1. Ahn VE, Faull KF, Whitelegge JP, Fluharty AL, Privé GG. Crystal structure of saposin B reveals a dimeric shell for lipid binding. Proc Natl Acad Sci USA. 2003;100:38–43. - PMC - PubMed
    1. Alattia JR, Shaw JE, Yip CM, Privé GG. Molecular imaging of membrane interfaces reveals mode of beta-glucosidase activation by saposin C. Proc Natl Acad Sci USA. 2007;104:17394–17399. - PMC - PubMed
    1. O’Brien JS, et al. Coding of two sphingolipid activator proteins (SAP-1 and SAP-2) by same genetic locus. Science. 1988;241:1098–1101. - PubMed

Publication types

MeSH terms

Associated data

LinkOut - more resources