. 2012 Feb 7;109(6):1842-9.
doi: 10.1073/pnas.1120312109. Epub 2012 Jan 30.

Predictable and efficient carbon sequestration in the North Pacific Ocean supported by symbiotic nitrogen fixation

Affiliations

Predictable and efficient carbon sequestration in the North Pacific Ocean supported by symbiotic nitrogen fixation

David M Karl et al. Proc Natl Acad Sci U S A. .

Abstract

The atmospheric and deep sea reservoirs of carbon dioxide are linked via physical, chemical, and biological processes. The last of these include photosynthesis, particle settling, and organic matter remineralization, and are collectively termed the "biological carbon pump." Herein, we present results from a 13-y (1992-2004) sediment trap experiment conducted in the permanently oligotrophic North Pacific Subtropical Gyre that document a large, rapid, and predictable summertime (July 15-August 15) pulse in particulate matter export to the deep sea (4,000 m). Peak daily fluxes of particulate matter during the summer export pulse (SEP) average 408, 283, 24.1, 1.1, and 67.5 μmol·m(-2)·d(-1) for total carbon, organic carbon, nitrogen, phosphorus (PP), and biogenic silica, respectively. The SEP is approximately threefold greater than mean wintertime particle fluxes and fuels more efficient carbon sequestration because of low remineralization during downward transit that leads to elevated total carbon/PP and organic carbon/PP particle stoichiometry (371:1 and 250:1, respectively). Our long-term observations suggest that seasonal changes in the microbial assemblage, namely, summertime increases in the biomass and productivity of symbiotic nitrogen-fixing cyanobacteria in association with diatoms, are the main cause of the prominent SEP. The recurrent SEP is enigmatic because it is focused in time despite the absence of any obvious predictable stimulus or habitat condition. We hypothesize that changes in day length (photoperiodism) may be an important environmental cue to initiate aggregation and subsequent export of organic matter to the deep sea.


Conflict of interest statement

The authors declare no conflict of interest.

Figures
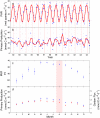
Fig. 1.
Fig. 1.
Composite of key environmental variables observed at Station ALOHA. (A) Climatological model of surface photosynthetically available radiation (PAR; red trend line) based on astronomical formulation and calibrated using high-resolution moored observations at Station ALOHA collected between January 1997 and May 1998 and 3-d average PAR measured during approximately monthly Hawaii Ocean Time-series (HOT) cruises (solid blue symbols). (B) Primary production based on 14C methodology measured during approximately monthly HOT cruises (solid blue symbols) along with three-point running mean (red trend line). (C) Annual climatology of mixed layer depth (MLD) of the upper euphotic zone for the period 1992–2004 based on a 0.125-unit potential density criterion showing the mean ± 1 SE. (D) Primary production (solid blue symbols; left y axis) and euphotic zone export (solid red symbols; right y axis) annual climatologies for the period 1992–2004 showing the mean ± 1 SE (note scale differences). The lightly shaded time periods correspond to the SEP period (July 15–August 15), when deep sea particulate matter fluxes are at their annual maxima. The dashed vertical lines in A and B mark the start of each year.
Fig. 2.
Fig. 2.
Primary production and carbon flux measured at Station ALOHA. (A) Plot of individual Hawaii Ocean Time-series (HOT) cruise measurements of primary production using 14C methodology and carbon flux from the base of the euphotic zone (150 m) utilizing drifting sediment traps. The dashed lines that bound the dataset are the export ratios (e-ratio = carbon flux/primary production) of 0.02 and 0.15. (B) E-ratios for approximately monthly occupations of Station ALOHA during the period 1989–2009. The horizontal red line is the mean of the entire dataset (mean = 0.0582, SE = 0.0017, n = 182). The dashed vertical lines mark the start of each year. (C) Monthly e-ratio climatology based on the data presented in B showing the mean ± 1 SE.
Fig. 3.
Fig. 3.
PC and PN fluxes at 4,000 m using bottom-moored sediment traps during the period of field observation (1992–2004). Arithmetic values (A and C) and logarithmic (base 10) values (B and D) of the PC or PN flux for each time period (usually 15–18 d; Materials and Methods) plotted on the midpoint of each collection period. The solid red horizontal lines in B and D are the mean PC (232.2 μmol·m−2·d−1) and PN (11.8 μmol·m−2·d−1) fluxes for the 13-y dataset. The dashed red horizontal lines in B and D are equal to 150% of the respective mean values. Points above this cutoff are referred to as “large flux events” in the main text. The lightly shaded period corresponds to the SEP period (July 15–August 15), when deep sea particulate matter fluxes are at their annual maxima. The dashed vertical lines mark the start of each year.
Fig. 4.
Fig. 4.
Annual flux climatologies at a reference depth of 4,000 m determined from bottom-moored sediment traps deployed during the period 1992–2004 (Materials and Methods). The yellow-shaded portion of the climatology is the winter period, when fluxes are low, and the red-shaded portion is the SEP. The dashed vertical lines mark the start of each month. Carbon flux is shown, including PC (blue), POC (red), and PIC (green) (A); PN flux (B); PP flux (C); and P-BSi flux (D).
Fig. 5.
Fig. 5.
PN flux climatologies (1992–2004) for reference depths of 150 m (A), 2,800 m (B), and 4,000 m (C). The solid red symbols in A represent the monthly mean values. The data in D represent the depth-dependent flux ratios between the values measured at the 4,000-m reference depth and those measured at the 2,800-m reference depth (solid blue symbols; left y axis) or the 150-m reference depth (solid red symbols; right y axis). The yellow-shaded portion of the climatology is the winter period, when fluxes are low, and the red-shaded portion is the SEP. The dashed vertical line marks the start of each month.
Fig. 6.
Fig. 6.
Station ALOHA PN fluxes and 15N abundance. (A) Annual climatology of 0- to 125-m depth-integrated N2 fixation rates measured during the period 2005–2011; solid blue symbols are observations, and solid red symbols are monthly mean values. (B) PN flux climatology at the 4,000-m reference level for the period 1992–2004. (C) δ15N-PN (vs. air standard) climatology based on the measured values at the 4,000-m reference depth for the period 1992–2004. The dashed vertical line marks the start of each month. Shaded portions as in Fig. 5.

References

    1. Field CB, Behrenfeld MJ, Randerson JT, Falkowski P. Primary production of the biosphere: Integrating terrestrial and oceanic components. Science. 1998;281:237–240. - PubMed
    1. Ryther JH. Photosynthesis and fish production in the sea. Science. 1969;166:72–76. - PubMed
    1. Martin JH, Knauer GA, Karl DM, Broenkow WW. VERTEX: Carbon cycling in the northeast Pacific. Deep-Sea Res Part A Oceanogr Res Pap. 1987;34:267–285.
    1. Volk T, Hoffert MI. In: The Carbon Cycle and Atmospheric CO2: Natural Variations Archean to Present. Sundquist ET, Broecker WS, editors. Washington, DC: American Geophysical Union; 1985. pp. 99–110.
    1. Legendre L, Rassoulzadegan F. Food-web mediated export of biogenic carbon in oceans: Hydrodynamic control. Mar Ecol Prog Ser. 1996;145:179–193.

Publication types