. 2012 Feb 7;109(6):2078-83.
doi: 10.1073/pnas.1120605109. Epub 2012 Jan 19.

Three differentiation states risk-stratify bladder cancer into distinct subtypes

Affiliations

Three differentiation states risk-stratify bladder cancer into distinct subtypes

Jens-Peter Volkmer et al. Proc Natl Acad Sci U S A. .

Erratum in

  • Proc Natl Acad Sci U S A. 2012 Feb 28;109(9):3600

Abstract

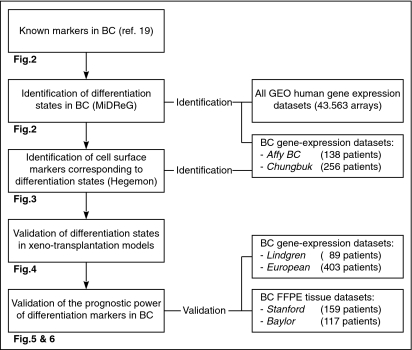
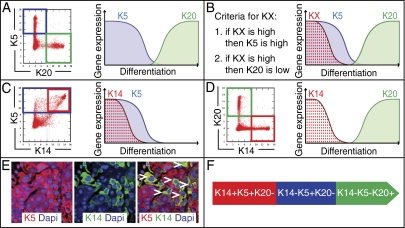
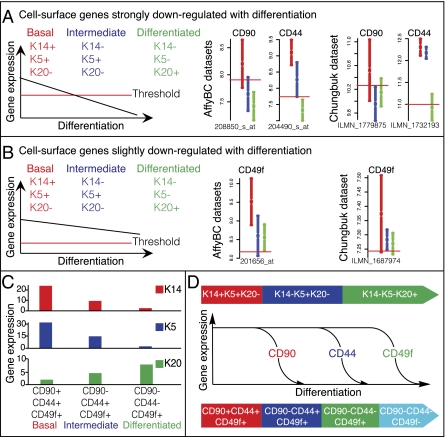
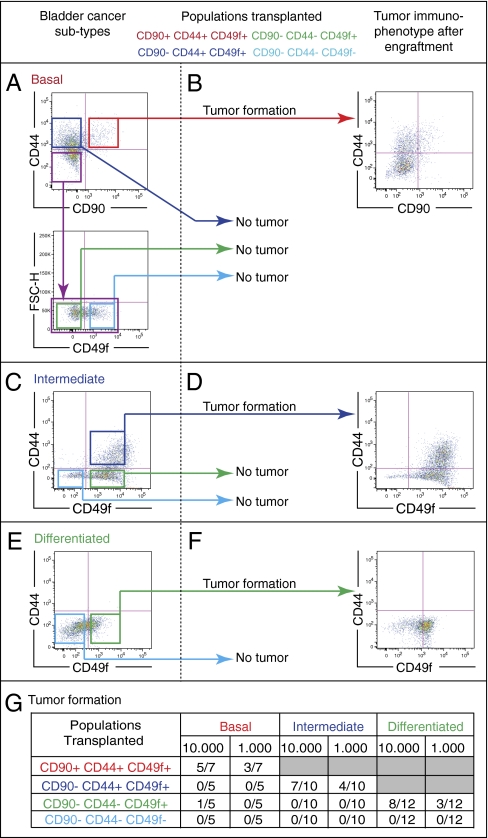
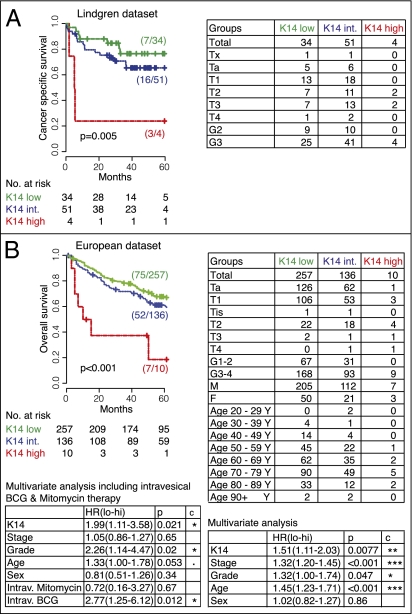
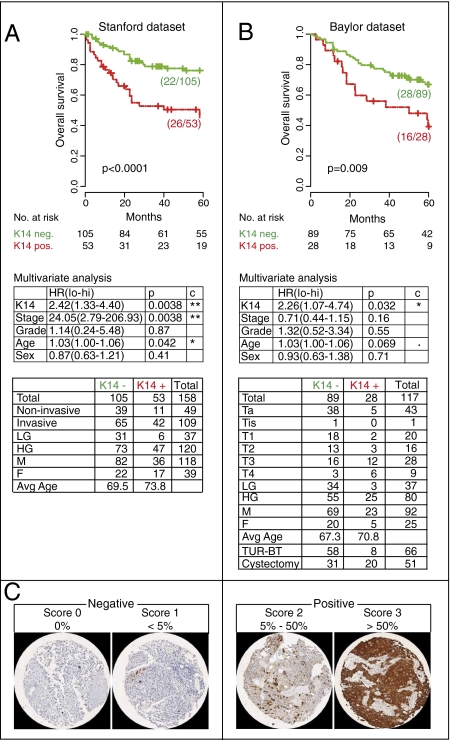
Current clinical judgment in bladder cancer (BC) relies primarily on pathological stage and grade. We investigated whether a molecular classification of tumor cell differentiation, based on a developmental biology approach, can provide additional prognostic information. Exploiting large preexisting gene-expression databases, we developed a biologically supervised computational model to predict markers that correspond with BC differentiation. To provide mechanistic insight, we assessed relative tumorigenicity and differentiation potential via xenotransplantation. We then correlated the prognostic utility of the identified markers to outcomes within gene expression and formalin-fixed paraffin-embedded (FFPE) tissue datasets. Our data indicate that BC can be subclassified into three subtypes, on the basis of their differentiation states: basal, intermediate, and differentiated, where only the most primitive tumor cell subpopulation within each subtype is capable of generating xenograft tumors and recapitulating downstream populations. We found that keratin 14 (KRT14) marks the most primitive differentiation state that precedes KRT5 and KRT20 expression. Furthermore, KRT14 expression is consistently associated with worse prognosis in both univariate and multivariate analyses. We identify here three distinct BC subtypes on the basis of their differentiation states, each harboring a unique tumor-initiating population.


Conflict of interest statement

Conflict of interest statement: I.L.W. owns Amgen stock and is a director of Stem Cells, Inc. To the authors’ knowledge neither entity has a direct interest in the research reported here.

Figures

Fig. 1.
Fig. 1.
Flowchart of identification and validation of differentiation states in BC. Markers of differentiation (keratins) are identified by using “mining developmentally regulated genes” (MiDReG) and corresponding cell surface markers are identified by using “hierarchical exploration of gene-expression microarray online” (Hegemon). The hypothetical hierarchy of differentiation is evaluated in patient tumor cell xenotransplantation mouse models. Association of differentiation states in bladder cancer with patient outcome is validated with existing databases and archival tissues.
Fig. 2.
Fig. 2.
Keratin 14, -5, and -20 define three differentiation states in BC. Keratins are abbreviated as KX. (A) K5 is expressed early during differentiation (blue) and its expression is temporally exclusive with that of the terminal differentiation marker K20 (green) in bladder cancer (BC). The mutual relationship of K5 and K20 in their temporal expression is consistent across diverse tissues (totaling 75,000 data points) in multiple species (human, mouse, and rat; Fig. S1 BE). (B) Schematic illustrating the principle behind the computational strategy MiDReG used to predict a keratin X (KX, red), which is precursor to K5 and K20 by fulfilling two Boolean relationships: (i) when KX expression is high (red), expression of the early progenitor marker K5 is also high (blue) and (ii) when KX expression is high (red), expression of the differentiation marker K20 is low (green). (C) K14 fulfills the first Boolean relationship, its expression is high (red) when the expression of early progenitor marker K5 is also high (blue). (D) K14 fulfills the second Boolean relationship, its expression is low (red) when the expression of terminal differentiation marker K20 is high (green). (E) KRT14-expressing cells (Alexa 488/green) mark a subpopulation of KRT5+ cells (Alexa 594/red) in BC; white arrows indicate double positive cells, yellow. (F) Schematic illustration of the three predicted differentiation states in urothelial biology.
Fig. 3.
Fig. 3.
Discovery of corresponding surface markers to keratins for differentiation states in BC. Keratins are abbreviated as KX. Schematics demonstrating the two criteria used to set the threshold for discovering surface markers that would correspond with the following differentiation states (K14+K5+K20 red; K14K5+K20 blue; K14K5K20+ green). The discovery analysis was performed in the AffyBC and the Chungbuk datasets (red horizontal line indicates the StepMiner-based threshold). Boxplots with mean and confidence interval for cell surface genes that fulfill the two separate criteria were shown independently. (A) The threshold was set in a way that would discover surface markers that were highly expressed in basal cells (K14+K5+K20, red) and strongly down-regulated during differentiation. (B) The threshold was set in a way that would discover surface markers that highly expressed all three differentiation states (red, blue, and green), and slightly down-regulated during differentiation. The detailed method of discovery and ranking of cell surface markers is presented in Fig. S3 and listed in Dataset S1. (C) Messenger RNA expression of K14, K5, and K20 in each of the differentiation states defined by corresponding surface markers was analyzed by real-time PCR. Corresponding surface marker combination that defines each differentiation state was listed in the x axis, representing basal, intermediate, and differentiated states, respectively. The relative gene-expression level was indicated in the y axis. (D) Schematic illustrating BC differentiation states as defined by keratin (K) and corresponding surface marker expression profiles.
Fig. 4.
Fig. 4.
Functional validation of the computationally predicted differentiation states in BC. In vivo validation of three phenotypically distinct subtypes of bladder cancer (BC) according to their differentiation states: (A) basal, (C) intermediate, and (E) differentiated as defined by surface marker profiles (CD90, CD44, and CD49f). BC cells were purified by FACS and xenotransplanted intradermally into immunodeficient mice in limited dilution (103 and 104). (B, D, and F) The immunophenotypes of xenograft tumors derived from each BC subtype were reanalyzed by FACS postengraftment. (A) The basal BC subtype is composed of all differentiation states [CD90+CD44+CD49f+ (red box) → CD90CD44+CD49f+ (blue box) → CD90CD44CD49f+ (green box) → CD90CD44CD49f (light blue box)]. (B) Only the most upstream (CD90+CD44+CD49f+) population forms xenograft tumors and recapitulates all downstream differentiation states (CD90CD44+CD49f+ → CD90CD44CD49f+ → CD90CD44CD49f). (C) The intermediate BC subtype lacks the basal differentiation state (CD90+CD44+CD49f+). (D) Only the most upstream differentiation state (CD90CD44+CD49f+) forms xenograft tumors and can reconstitute all downstream states (CD90CD44CD49f+ → CD90CD44CD49f). (E) In differentiated BCs that lack both the basal (CD90+CD44+CD49f+) and the intermediate (CD90CD44+CD49f+) differentiation states, (F) only the existing differentiation state (CD90CD44CD49f+) forms xenograft tumors and recapitulates the terminally differentiated (CD90CD44CD49f) downstream state. (A, C, and E) The terminally differentiated subpopulations (CD90CD44CD49f) never give rise to tumors. (G) Frequency of tumor formation of all transplanted cell populations described in A, C, and E.
Fig. 5.
Fig. 5.
Keratin 14 gene expression is associated with worse patient survival in BC. Kaplan–Meier analysis of the probability of cancer-specific (A) and overall (B) survival according to differentiation states in bladder cancer as defined by Keratin 14 (K14) gene-expression level in two independent datasets, Lindgren (A) and European (B).
Fig. 6.
Fig. 6.
Keratin 14 protein expression is associated with worse patient survival in BC. (A and B) Kaplan–Meier analysis of the probability of overall survival according to differentiation states in bladder cancer as defined by keratin 14 (K14) in two independent tissue datasets, Stanford (A) and Baylor (B). (C) Representative micrographs of K14 IHC staining, scoring (0–3), and stratification (negative, 0–1; positive, 2–3) are presented.

References

    1. US Cancer Statistics Working Group United States Cancer Statistics: 1999–2007 Incidence and Mortality Web-Based Report (US Department of Health and Human Services, Centers for Disease Control and Prevention, and National Cancer Institute, Atlanta) 2010. Available at http://apps.nccd.cdc.gov/uscs/toptencancers.aspx. Accessed November 9, 2010.
    1. Jemal A, Siegel R, Xu J, Ward E. Cancer statistics, 2010. CA Cancer J Clin. 2010;60:277–300. - PubMed
    1. Wu XR. Urothelial tumorigenesis: A tale of divergent pathways. Nat Rev Cancer. 2005;5:713–725. - PubMed
    1. Lewis SA. Everything you wanted to know about the bladder epithelium but were afraid to ask. Am J Physiol Renal Physiol. 2000;278:F867–F874. - PubMed
    1. Weissman I. Stem cell research: Paths to cancer therapies and regenerative medicine. JAMA. 2005;294:1359–1366. - PubMed

Publication types

MeSH terms