. 2012 Mar 13;109(11):4187-90.
doi: 10.1073/pnas.1120774109. Epub 2012 Jan 30.

The maximum rate of mammal evolution

Affiliations

The maximum rate of mammal evolution

Alistair R Evans et al. Proc Natl Acad Sci U S A. .

Abstract

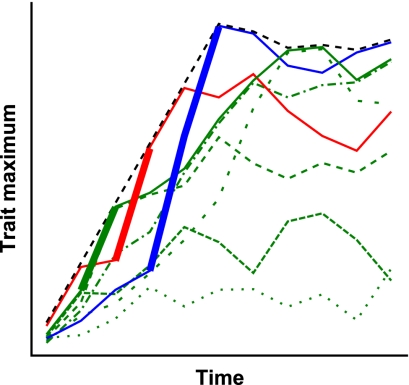
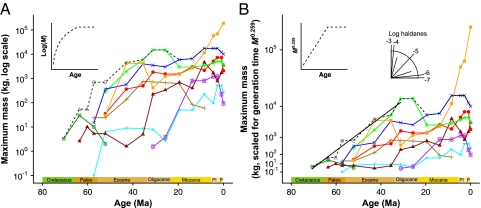
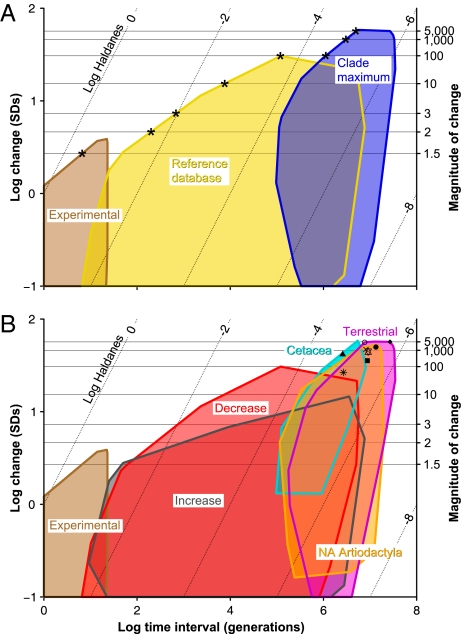
How fast can a mammal evolve from the size of a mouse to the size of an elephant? Achieving such a large transformation calls for major biological reorganization. Thus, the speed at which this occurs has important implications for extensive faunal changes, including adaptive radiations and recovery from mass extinctions. To quantify the pace of large-scale evolution we developed a metric, clade maximum rate, which represents the maximum evolutionary rate of a trait within a clade. We applied this metric to body mass evolution in mammals over the last 70 million years, during which multiple large evolutionary transitions occurred in oceans and on continents and islands. Our computations suggest that it took a minimum of 1.6, 5.1, and 10 million generations for terrestrial mammal mass to increase 100-, and 1,000-, and 5,000-fold, respectively. Values for whales were down to half the length (i.e., 1.1, 3, and 5 million generations), perhaps due to the reduced mechanical constraints of living in an aquatic environment. When differences in generation time are considered, we find an exponential increase in maximum mammal body mass during the 35 million years following the Cretaceous-Paleogene (K-Pg) extinction event. Our results also indicate a basic asymmetry in macroevolution: very large decreases (such as extreme insular dwarfism) can happen at more than 10 times the rate of increases. Our findings allow more rigorous comparisons of microevolutionary and macroevolutionary patterns and processes.


Conflict of interest statement

The authors declare no conflict of interest.

Figures

Fig. 1.
Fig. 1.
Evolutionary rate of the clade maximum for a trait can underestimate the maximum evolutionary rate of subclades or component lower taxa within the clade. The black dashed line represents the maximum for a clade composed of three subclades represented by green, red, and blue lines. Each of these subclades is composed of lineages of species, shown for the green clade as thin broken lines. When a different subclade becomes the new clade maximum, it must have a higher evolutionary rate than the clade maximum for that interval: the thick lines represent this process.
Fig. 2.
Fig. 2.
Maximum mammalian body mass over time for terrestrial mammals (dashed black line) and separate mammal orders (colored lines). (A) Log(M) vs. Age shows an asymptotic relationship for the mammalian maximum. (B) Mass is scaled to the power of 0.259 on the y axis (given an empirical M0.259 scaling of generation times), so the slope of lines indicates generation time-corrected evolutionary rates as indicated by an angular scale (haldanometer). Inset graphs show how an asymptotic relationship for M vs. Age can result in a linear trajectory for M0.259 vs. Age, as found for terrestrial mammals from 70 to 30 Ma (solid black line in B). Rates were calculated separately for the orders in color; when other orders comprise the maximum size across all mammals, they are shown in gray. Artiodactyls (red circle), carnivorans (red triangle), cetaceans (orange square), creodonts (brown plus sign), multituberculates (green cross in square), perissodactyls (green asterisk), primates (cyan diamond), proboscideans (blue X), rodents (purple star), condylarths (open gray triangle), dinoceratans (open gray diamond), pantodonts (open gray circle). Time units: Paleo, Paleocene; Pl, Pliocene; P, Pleistocene.
Fig. 3.
Fig. 3.
Maximum rates of evolution for large changes in mammalian body mass. Minimum convex polygons of rates plotted as log change in body mass (in units of SD) vs. log time interval (generations). (A) The three datasets compared in this study: experimental rates (3, 14) (brown), 1,453 rates from previous studies (yellow), and clade maximum rates (blue). Asterisks indicate minimum number of generations to evolve a given amount of change. (B) Datasets split into components. Compiled rates are separated into increases (gray) and decreases (red) and clade maximum rates (all of which are increases) into terrestrial orders (pink), cetaceans (cyan), and North American artiodactyls (orange). Points show average rates for linear increase in Table 1 for terrestrial mammals (open circle), artiodactyls (closed circle), carnivorans (square), cetaceans (triangle), perissodactyls (asterisk), primates (diamond), proboscideans (X), and rodents (star). Right-hand y axis and horizontal lines illustrate magnitude of change in body mass. Large decreases (>2-fold) require substantially less time than increases, and maximum rates for very large changes (>100-fold) in cetaceans are about twice those in terrestrial. Diagonal dotted lines are isohaldanes, equal rates measured in log haldanes.

Comment in

  • Measuring the evolution of body size in mammals.
    Polly PD. Polly PD. Proc Natl Acad Sci U S A. 2012 Mar 13;109(11):4027-8. doi: 10.1073/pnas.1201030109. Epub 2012 Feb 21. Proc Natl Acad Sci U S A. 2012. PMID: 22355132 Free PMC article. No abstract available.

Similar articles

Cited by

References

    1. Simpson GG. The Major Features of Evolution. New York: Simon and Schuster; 1953.
    1. Stanley SM. Macroevolution: Pattern and Process. San Francisco: W. H. Freeman; 1979.
    1. Gingerich PD. Rates of evolution on the time scale of the evolutionary process. Genetica. 2001;112-113:127–144. - PubMed
    1. Hutchinson GE. Variations on a theme by Robert MacArthur. In: Cody ML, Diamond JM, editors. Ecology and Evolution of Communities. Cambridge: Belknap Press; 1975. pp. 492–512.
    1. Peters RH. The Ecological Implications of Body Size. Cambridge: Cambridge Univ Press; 1983.

Publication types

LinkOut - more resources