. 2012 Feb 21;109(8):E515-23.
doi: 10.1073/pnas.1121626109. Epub 2012 Jan 30.

Reduced release probability prevents vesicle depletion and transmission failure at dynamin mutant synapses

Affiliations

Reduced release probability prevents vesicle depletion and transmission failure at dynamin mutant synapses

Xuelin Lou et al. Proc Natl Acad Sci U S A. .

Abstract

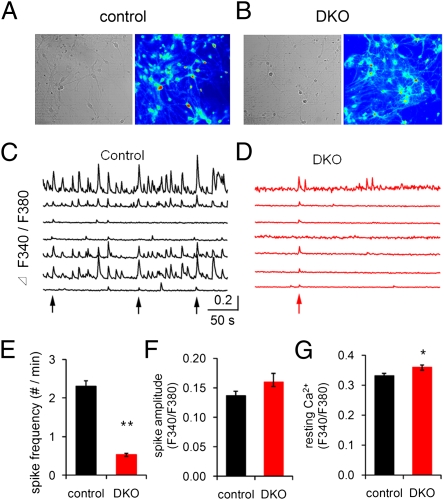
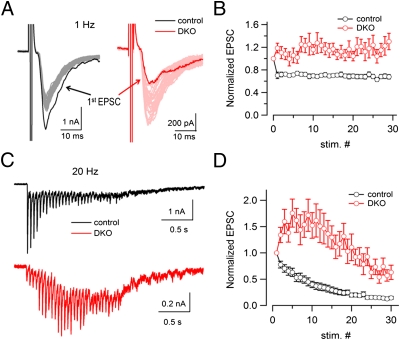
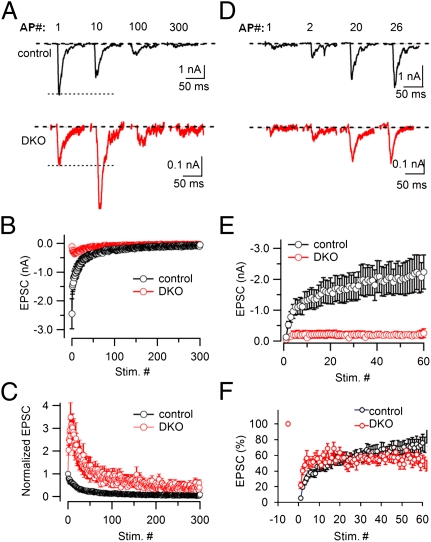
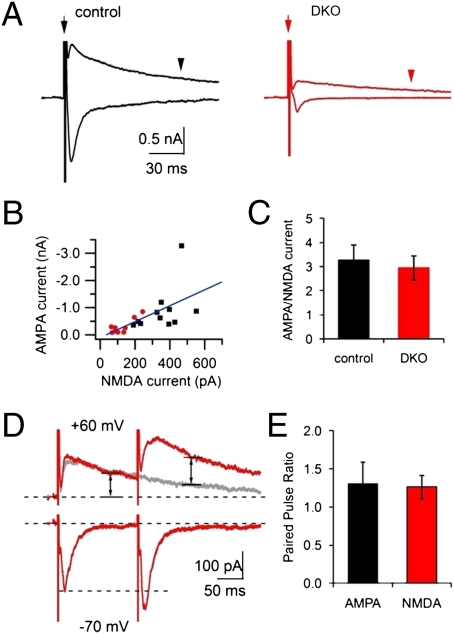
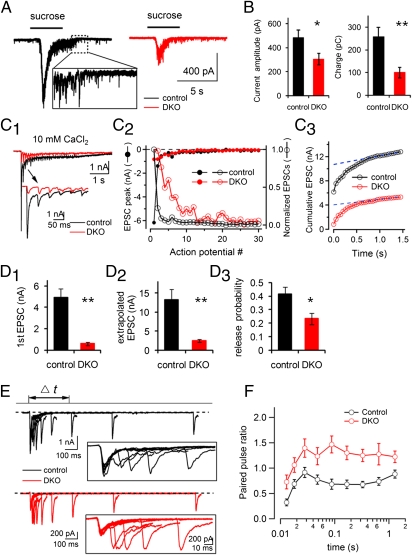
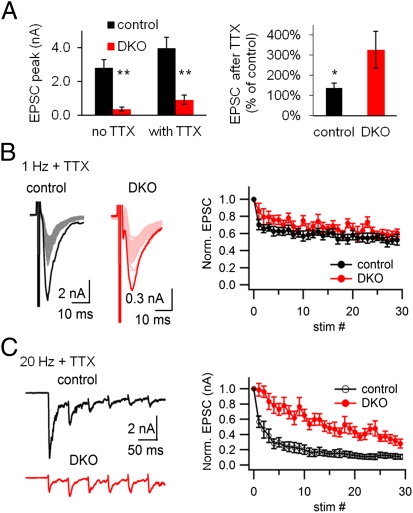
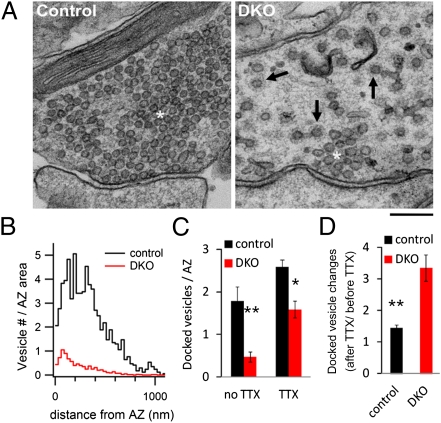
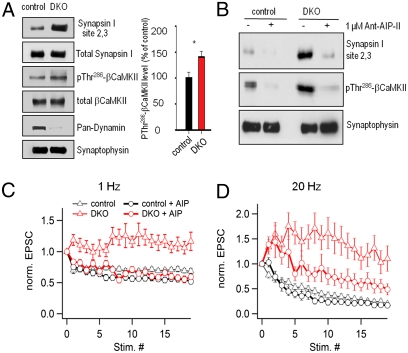
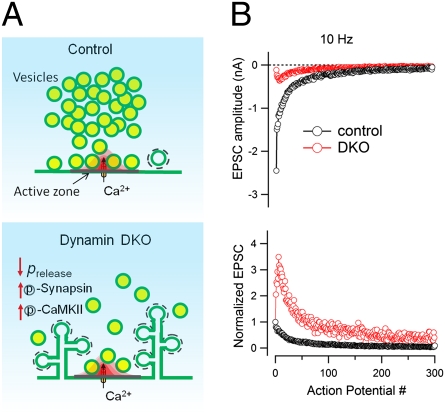
Endocytic recycling of synaptic vesicles after exocytosis is critical for nervous system function. At synapses of cultured neurons that lack the two "neuronal" dynamins, dynamin 1 and 3, smaller excitatory postsynaptic currents are observed due to an impairment of the fission reaction of endocytosis that results in an accumulation of arrested clathrin-coated pits and a greatly reduced synaptic vesicle number. Surprisingly, despite a smaller readily releasable vesicle pool and fewer docked vesicles, a strong facilitation, which correlated with lower vesicle release probability, was observed upon action potential stimulation at such synapses. Furthermore, although network activity in mutant cultures was lower, Ca(2+)/calmodulin-dependent protein kinase II (CaMKII) activity was unexpectedly increased, consistent with the previous report of an enhanced state of synapsin 1 phosphorylation at CaMKII-dependent sites in such neurons. These changes were partially reversed by overnight silencing of synaptic activity with tetrodotoxin, a treatment that allows progression of arrested endocytic pits to synaptic vesicles. Facilitation was also counteracted by CaMKII inhibition. These findings reveal a mechanism aimed at preventing synaptic transmission failure due to vesicle depletion when recycling vesicle traffic is backed up by a defect in dynamin-dependent endocytosis and provide new insight into the coupling between endocytosis and exocytosis.


Conflict of interest statement

The authors declare no conflict of interest.

Figures

Fig. 1.
Fig. 1.
Reduced spontaneous network activity in cortical neuronal cultures derived from dynamin 1 and 3 double-KO (DKO) mice. (A and B) Differential interference contrast images and fluorescence images excited at 380 nm (F380) from a control (A) and a DKO (B) culture preloaded with Fura-2 AM under a 20× water immersion objective (NA = 0.6). (C and D) Intracellular Ca2+ responses (F340/F380 fluorescence) of individual neurons from control and DKO cultures shown in A and B. Arrows indicate synchronized Ca2+ spikes. (E–G) Ca2+ spike frequency (E), amplitude (F), and resting Ca2+ levels (G) in control and DKO cultures (control, n = 99 neurons; DKO, n = 85 DKO neurons; *P < 0.05, **P < 0.01).
Fig. 2.
Fig. 2.
Strong synaptic facilitation in response to both low- and high-frequency stimulation at DKO synapses. (A) Superimposed traces of EPSCs elicited by 30 APs at 1 Hz in a control and a DKO neuron. The first EPSC is shown as a solid trace. Note the different EPSC scales for the neurons of the two genotypes. (B) Average normalized EPSCs elicited by 30 APs at 1 Hz from control (n = 21) and DKO neurons (n = 18). EPSCs were normalized to the peak amplitude of the first EPSC in each AP train. (C) EPSCs recorded from a control and a DKO neuron in response to 30 APs at 20 Hz. (D) Average normalized EPSCs elicited by 30 APs at 20 Hz from control (n = 18) and DKO (n = 16) neurons. EPSCs were normalized to the peak amplitude of the first EPSC in each AP train. Note the depression at control synapses and facilitation at DKO synapses.
Fig. 3.
Fig. 3.
Synaptic vesicle depletion and recovery in the absence of dynamin 1 and 3. (A) Individual EPSCs recorded during a 300-APs train at 10 Hz (i.e., a stimulus leading to a near depletion of releasable synaptic vesicles) in a control and a DKO neuron. The AP number is indicated at the top. (B and C) Average EPSC amplitudes (B) and normalized EPSCs (C) from control (n = 14) and DKO neurons (n = 14). (D) Recovery of synaptic transmission immediately after the vesicle depletion induced by 300 APs at 10 Hz in a control neuron and a DKO neuron. Recovery was estimated by EPSCs induced with AP stimulation at 0.2 Hz. Individual EPSCs were recorded at different times during the recovery. The AP number is indicated at the top. (E and F) Time course of EPSC recovery after vesicle depletion in control (n = 12) and DKO neurons (n = 15). EPSCs were normalized to the first EPSC amplitude of the depletion train (F).
Fig. 4.
Fig. 4.
Presynaptic origin of the facilitation observed at DKO synapses. (A) AMPA and NMDA currents triggered by single APs. The amplitude of NMDA currents recorded at +60 mV (holding potential) was measured at a time point of 100 ms (arrowhead) after the AP stimulation (arrow), the same as for B–D. (B and C) Smaller AMPA and NMDA current amplitude (B) but similar AMPA/NMDA current ratio (C) at control (n = 11) and DKO neurons (n = 9). (D) AMPA and NMDA currents induced by a paired pulse (at 100-ms intervals). The second NMDA current amplitude (second arrow) was measured at 100 ms after the second AP but subtracting the residual component of NMDA current from the first AP (gray trace, obtained by a single AP at the same neuron). (E) Paired-pulse ratio of AMPA/NMDA currents in both control and DKO cultures (n = 5 for each).
Fig. 5.
Fig. 5.
Readily releasable pool (RRP) and vesicle release probability are reduced in DKO synapses. (A) A total of 500 mM sucrose evoked EPSCs from a control and a DKO neuron. (B) The RRP, as estimated by both EPSC amplitude and total charge transfer, is smaller in DKO synapses than in control (n = 21, control; n = 18, DKO; *P < 0.05, **P < 0.01). (C1–C3) Estimation of the RRP by a high-frequency AP train in 10 mM extracellular CaCl2. (C1) EPSCs evoked by 30 APs at 20 Hz. (C2) EPSC peaks (solid circles, left axis) and synaptic depression (open circles, right axis) from the data shown in C1. (C3) Linear regression of the EPSC steady state and back extrapolation (to time 0) from control and DKO synapses. (D1–D3) Average initial EPSC amplitude (D1), RRP (D2), and vesicle release probability (D3) from control (n = 9) and DKO neurons (n = 11; *P < 0.05, **P < 0.01). (E) Representative EPSCs induced by paired-pulse stimuli at variable interpulse intervals from a control and a DKO neuron. (Inset) Synaptic responses at an expanded timescale. Note the strong facilitation at the DKO neuron. (F) Average paired-pulse ratios in control (n = 16) and DKO (n = 17) neurons show that the ratios from DKO neurons are higher at all time intervals tested.
Fig. 6.
Fig. 6.
Synaptic facilitation at DKO synapses is activity dependent and partially reversible. (A) EPSC amplitude increases after silencing spontaneous network activity with TTX in control and DKO neurons (n = 14 for control, n = 10 for DKO; *P < 0.05, **P < 0.01). (B) TTX exposure completely reversed the synaptic facilitation observed in DKO neuronal cultures upon stimulation at 1 HZ, so that a similar depression was observed in DKO and controls. Representative recording (Left) and normalized EPSCs (Right) from control (n = 16) and DKO neurons (n = 14) subjected to 1 Hz stimulation after overnight TTX treatment are shown. (C) TTX exposure also abolished the facilitation observed in DKO neurons upon high-frequency stimulation (20 Hz). In this case, a depression was observed in both DKO and controls, although this depression was smaller than controls. Representative recording (Left) and normalized EPSCs (Right) from control (n = 13) and DKO neurons (n = 12) subjected to 20 Hz stimulation after overnight TTX treatment are shown.
Fig. 7.
Fig. 7.
Active zone ultrastructure and docked vesicles at DKO synapses. (A) Electron microscopy appearance of a control (Left) and a DKO (Right) synapse. Note in the DKO axon terminal the smaller synaptic vesicle cluster at the active zone of the synapse, which is surrounded by a large number of coated vesicular profiles (arrows), some of which have tubular necks in the plane of the section. As described previously (35), most clathrin-coated vesicular profiles are pits and not vesicles. White asterisks label the vesicle cluster in both micrographs. (Scale bar, 200 nm.) (B) Spatial distribution of synaptic vesicles around active zones in control (n = 19) and DKO synapses (n = 80). (C) Number of vesicles docked at the presynaptic plasma membrane of active zones before (n = 19, control; n = 80, DKO; P < 0.01) and after an overnight TTX treatment (n = 86, control; n = 63, DKO; P < 0.01). (D) Relative increase of the docked vesicle numbers per active zone after TTX treatment at control and DKO synapses. The data after TTX (shown in C) were normalized to the average number of docked vesicles before TTX was added. Note the stronger increase of the number of docked vesicles at DKO synapses.
Fig. 8.
Fig. 8.
Up-regulation of CaMKII activity contributes to facilitation at DKO synapses. (A) (Left) immunoblotting analysis revealing that levels of phospho-βCaMKII (threonine 286) and phospho-synapsin I (sites 2 and 3, serines 566 and 603) are increased in DKO neuronal cultures relative to control. Total levels of these proteins, as well as of synaptophysin, used as a loading control, are unchanged. The genotype of the DKO was confirmed by the pan-dynamin signal. (Right) Quantification (percentage of control) of the phospho-βCaMKII (threonine 286) signal in control and DKO cultures (n = 4). (B) Effect of the Ant-AIP-II peptide on the phosphorylation of βCaMKII (threonine 286) and synapsin I (sites 2 and 3). (C and D) Effect of the Ant-AIP-II peptide on short-term synaptic plasticity in response to low- (1 Hz) (C) and high (20 Hz) (D)-frequency stimulation in control (n = 12 and 11, respectively) and DKO synapses (n = 10 and 12, respectively).
Fig. P1.
Fig. P1.
Synaptic facilitation at synapses that lack dynamin 1 and 3. (A) Ultrastructure of presynaptic terminals in control and dynamin 1 and 3 DKO synapses. The DKO nerve terminal contains numerous arrested, deeply invaginated clathrin-coated pits and fewer synaptic vesicles, correlating with a lower probability of release and an increased activity state of CaMKII and the phosphorylation state of the synaptic vesicle-associated protein synapsin 1, a substrate for this kinase. (B) Short-term synaptic plasticity at control and DKO synapses. (Upper) EPSCs recorded during a train of 10-Hz action potentials. (Lower) EPSCs traces were normalized to the size of the first EPSC. Note the strong facilitation at DKO synapses in contrast to the enhanced depression typically observed at synapses on the genetic perturbation of endocytic proteins. Red areas near active zones show microdomain during exposure to a sharp rise in Ca2+ after depolarization. Dashed black lines, clathrin coats.

Similar articles

Cited by

References

    1. Fioravante D, Regehr WG. Short-term forms of presynaptic plasticity. Curr Opin Neurobiol. 2011;21:269–274. - PMC - PubMed
    1. Zucker RS, Regehr WG. Short-term synaptic plasticity. Annu Rev Physiol. 2002;64:355–405. - PubMed
    1. Dobrunz LE, Stevens CF. Heterogeneity of release probability, facilitation, and depletion at central synapses. Neuron. 1997;18:995–1008. - PubMed
    1. Schneggenburger R, Sakaba T, Neher E. Vesicle pools and short-term synaptic depression: Lessons from a large synapse. Trends Neurosci. 2002;25:206–212. - PubMed
    1. Dittman JS, Regehr WG. Calcium dependence and recovery kinetics of presynaptic depression at the climbing fiber to Purkinje cell synapse. J Neurosci. 1998;18:6147–6162. - PMC - PubMed

Publication types

Substances

LinkOut - more resources