. 2012 Apr;53(4):810-9.
doi: 10.1194/jlr.D019547. Epub 2012 Feb 3.

Quantification and visualization of phosphoinositides by quantum dot-labeled specific binding-domain probes

Affiliations

Quantification and visualization of phosphoinositides by quantum dot-labeled specific binding-domain probes

Yasuhiro Irino et al. J Lipid Res. 2012 Apr.

Abstract

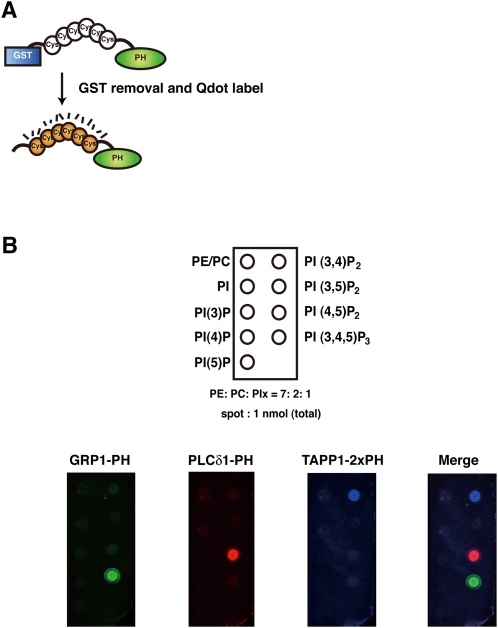
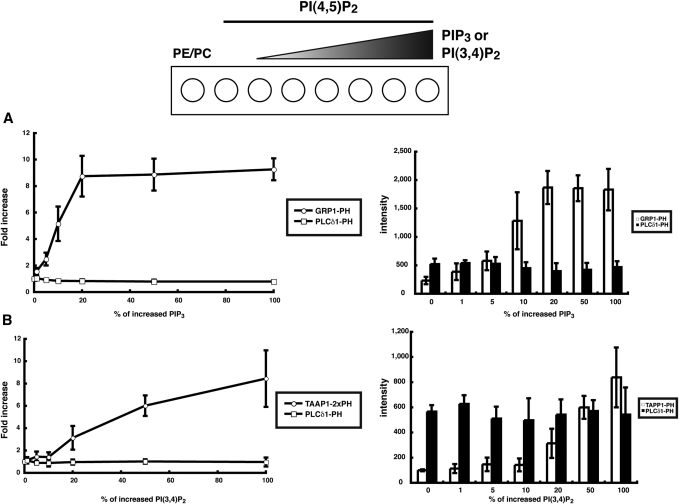
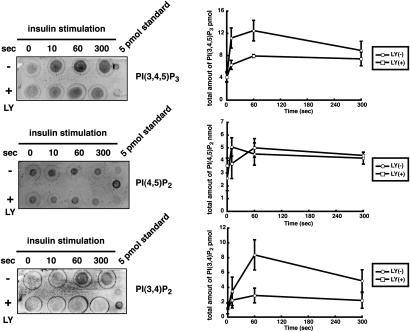
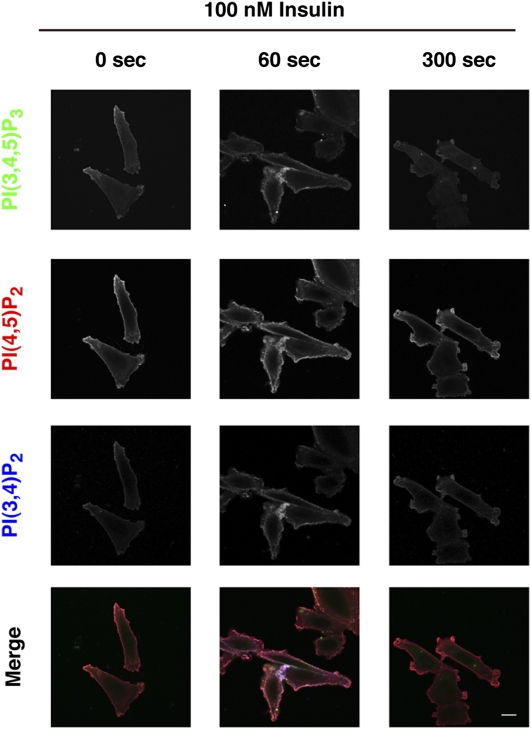
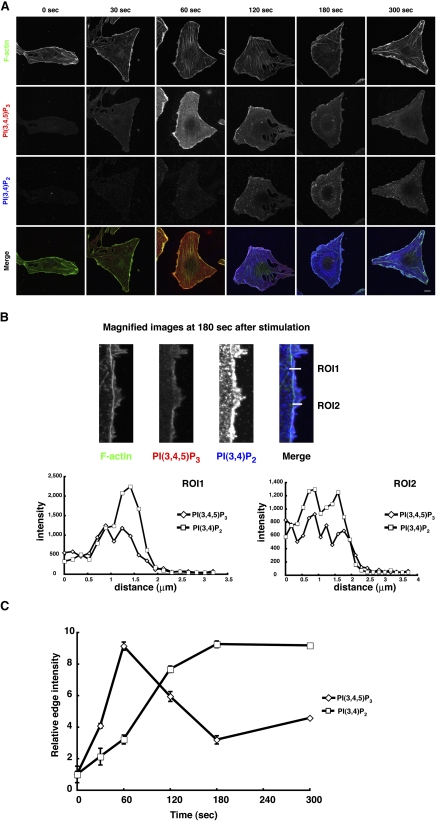
Phosphoinositides (PI) play important regulatory roles in cell physiology. Localization and quantitation of PIs within the cell is necessary to understand their precise function. Currently, ectopic expression of green fluorescent protein (GFP)-fused PI-binding domains is used to visualize PIs localized to the cell membrane. However, ectopically expressed PI-binding domains may compete with endogenous binding proteins, thus altering the physiological functions of the PIs. Here, we establish a novel method for quantification and visualization of PIs in cells and tissue samples using PI-binding domains labeled with quantum dots (Qdot) as specific probes. This method allowed us to simultaneously quantify three distinct PIs, phosphatidylinositol 3,4,5-triphosphatase [PtdIns(3,4,5)P(3)), PtdIns(3,4)P(2), and PtdIns(4,5)P(2), in crude acidic lipids extracted from insulin-stimulated cells. In addition, the method allowed the PIs to be visualized within fixed cells and tissues. Sequential and spatial changes in PI production and distribution were detected in platelet-derived growth factor (PDGF)-stimulated NRK49F cells. We also observed accumulation of PtdIns(3,4)P(2) at the dorsal ruffle in PDGF-stimulated NIH3T3 cells. Finally, we found PtdIns(3,4,5)P(3) was enriched in lung cancer tissues, which also showed high levels of phosphorylated Akt. Our new method to quantify and visualize PIs is expected to provide further insight into the role of lipid signaling in a wide range of cellular events.


Figures

Fig. 1.
Fig. 1.
Construction of specific PI binding probes by using PH domains. (A) Scheme for building PI-specific binding PH domains. PI-binding PH domains were expressed and purified as GST fusion proteins. GST was removed by incubation with PreScission protease, and PH domains were then covalently coupled to Qdots. (B) Binding specificity of probes in a dot blot assay. One nanomole of liposome (PE: PC: PIx = 7: 2: 1) was spotted onto a nitrocellulose membrane. The membrane was incubated with Qdot-6Cys-GRP1-PH, Qdot-6Cys-PLCδ1-PH, and Qdot-6Cys-TAPP1-2×PH domains.
Fig. 2.
Fig. 2.
Sensitivity of Qdot-labeled probes for each PI. The indicated amount of liposomes consisting of (PE: PC: PIx = 7: 2: 1) were spotted onto a nitrocellulose membrane and incubated with Qdot-labeled probes.
Fig. 3.
Fig. 3.
Specificity of Qdot-labeled probes. Liposomes were formed consisting of PE: PC = 7: 2, a constant amount of PtdIns(4,5)P2, and 0, 1, 5, 10, 20, 50, or 100 pmol of either PtdIns(3,4,5)P3 (A) or PtdIns(3,4)P2 (B). Liposomes were spotted on the membrane, which was then incubated with either Qdot-6Cys-GRP1-PH and Qdot-6Cys-PLCδ1-PH (A) or Qdot-6Cys-TAPP1-2×PH and Qdot-6Cys-PLCδ1-PH (B). The circles in the left graphs indicate the increase in GRP1-PH signals (A) or TAPP1-2×PH signals (B), and the squares show the corresponding increases in the PLCδ1-PH signals (A and B). Histograms on the right show the absolute intensity values of the indicated probes. Results are the mean ± SD of three independent experiments.
Fig. 4.
Fig. 4.
Quantification of PtdIns(3,4,5)P3, PtdIns(4,5)P2, and PtdIns(3,4)P2 in insulin-stimulated CHO-IR cells. Before stimulation, cells were incubated for 15 min with 25 μM of LY294002 [LY(+) or LY(−)]. For quantification of PtdIns(4,5)P2, lipids were diluted 100-fold before spotting. A standard curve was used for quantification. Data are mean ± SD of three independent experiments.
Fig. 5.
Fig. 5.
Costaining of PtdIns(3,4,5)P3, PtdIns(4,5)P2, and PtdIns(3,4)P2 in insulin-stimulated CHO-IR cells. PtdIns(3,4,5)P3 and PtdIns(3,4)P2 were produced at plasma membranes in response to insulin stimulation. Cells were incubated with 100 nM insulin for the indicated times, fixed, and stained with lipid binding probes. Bar = 10 μm.
Fig. 6.
Fig. 6.
Distinct localization of PtdIns(3,4,5)P3 and PtdIns(3,4)P2 in PDGF-stimulated NRK49F cells. (A) NRK49F cells were stimulated with PDGF for the indicated times. The cells were fixed and then stained with probes for PtdIns(3,4,5)P3 and PtdIns(3,4)P2. Bar = 10 μm. (B) Magnified images of the cell edge in PDGF-stimulated cells after 180 s. The graphs show the intensity of PtdIns(3,4,5)P3 (diamonds) and PtdIns(3,4)P2 (squares) in ROI1 and ROI2. (C) Fluorescence intensity of Qdot-6Cys-GRP1-PH and Qdot-6Cys-TAPP1-2×PH staining at the cell edge was quantified. Data represents mean ± SD (n = 3), with the signals at time 0 taken as the standard.
Fig. 7.
Fig. 7.
Localization of PtdIns(3,4)P2 in PDGF-induced dorsal ruffles of NIH3T3 cells. (A) Both PtdIns(3,4,5)P3 and PtdIns(3,4)P2 were present in peripheral membrane ruffles of NIH3T3 cells after PDGF stimulation. (B) PtdIns(3,4)P2 became concentrated in dorsal ruffles in response to PDGF stimulation. Arrow indicates the enrichment of PtdIns(3,4)P2 at the dorsal ruffle. The bar graph indicates the intensity profile in ROI1. Magnified images are derived from the regions shown by boxes. Bars = 10 μm in (A) and 20 μm in (B).
Fig. 8.
Fig. 8.
Localization of PIs in migrating cells. (A) NIH3T3 cells were stained with Qdot-6Cys-GRP1-PH, Qdot-6Cys-PLCδ1-PH, and Qdot-6Cys-TAPP1-2×PH after wound induction. Magnified images are derived from the solid and dashed boxes. An image of wound edge area is shown. (B) Graph shows intensity profiles of green, red, and blue channels in the ROI. (C) Graph shows mean ± SD (n = 3) of the ratio of front-to-rear fluorescence intensity of each channel. Bars = 20 μm.
Fig. 9.
Fig. 9.
Staining of PtdIns(3,4,5)P3 in lung tissue. Lung cancer tissue (squamous cell carcinoma) (A) and lung nonneoplastic tissue (B) were stained with pAkt (Ser473) antibody and Qdot-6Cys-GRP1-PH domains. Arrow indicates colocalization of PtdIns(3,4,5)P3 and phosphorylated Akt. TO-PRO-3 iodide was used for nuclear staining. Bars = 10 μm.

Similar articles

Cited by

References

    1. Janmey P. A., Lindberg U. 2004. Cytoskeletal regulation: rich in lipids. Nat. Rev. Mol. Cell Biol. 5: 658–666 - PubMed
    1. Di Paolo G., De Camilli P. 2006. Phosphoinositides in cell regulation and membrane dynamics. Nature. 443: 651–657 - PubMed
    1. Vicinanza M., D'angelo G., Di Campli A., De Matteis M. A. 2008. Function and dysfunction of the PI system in membrane trafficking. EMBO J. 27: 2457–2470 - PMC - PubMed
    1. Lazar D. F., Saltiel A. R. 2006. Lipid phosphatases as drug discovery targets for type 2 diabetes. Nat. Rev. Drug Discov. 5: 333–342 - PubMed
    1. Ooms L. M., Horan K. A., Rahman P., Seaton G., Gurung R., Kethesparan D. S., Mitchell C. A. 2009. The role of the inositol polyphosphate 5-phosphatases in cellular function and human disease. Biochem. J. 419: 29–49 - PubMed

Publication types

MeSH terms