. 2012 Feb 6:13:62.
doi: 10.1186/1471-2164-13-62.

Transcriptomic and proteomic analyses of the Aspergillus fumigatus hypoxia response using an oxygen-controlled fermenter

Affiliations

Transcriptomic and proteomic analyses of the Aspergillus fumigatus hypoxia response using an oxygen-controlled fermenter

Bridget M Barker et al. BMC Genomics. .

Abstract

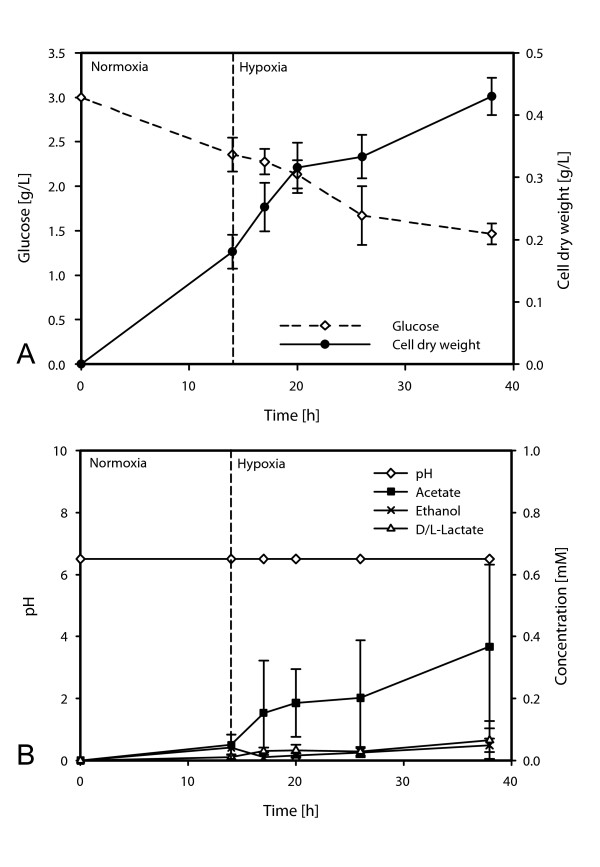
Background: Aspergillus fumigatus is a mold responsible for the majority of cases of aspergillosis in humans. To survive in the human body, A. fumigatus must adapt to microenvironments that are often characterized by low nutrient and oxygen availability. Recent research suggests that the ability of A. fumigatus and other pathogenic fungi to adapt to hypoxia contributes to their virulence. However, molecular mechanisms of A. fumigatus hypoxia adaptation are poorly understood. Thus, to better understand how A. fumigatus adapts to hypoxic microenvironments found in vivo during human fungal pathogenesis, the dynamic changes of the fungal transcriptome and proteome in hypoxia were investigated over a period of 24 hours utilizing an oxygen-controlled fermenter system.

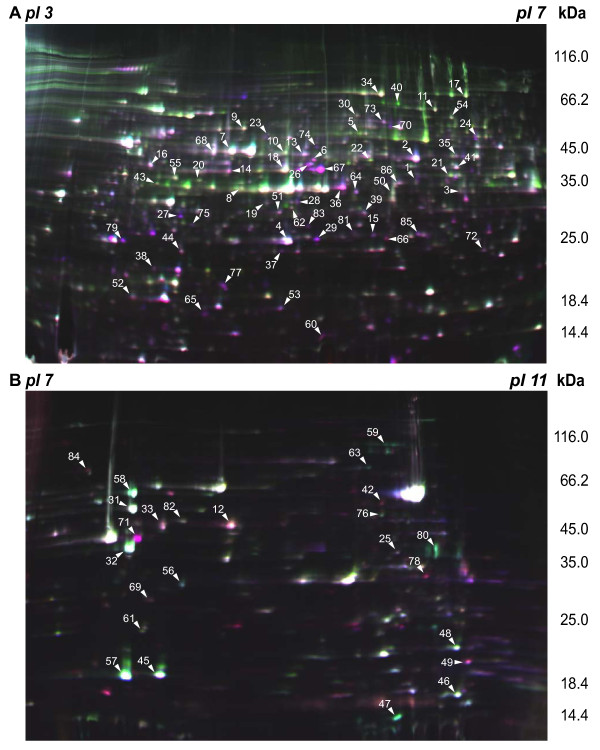
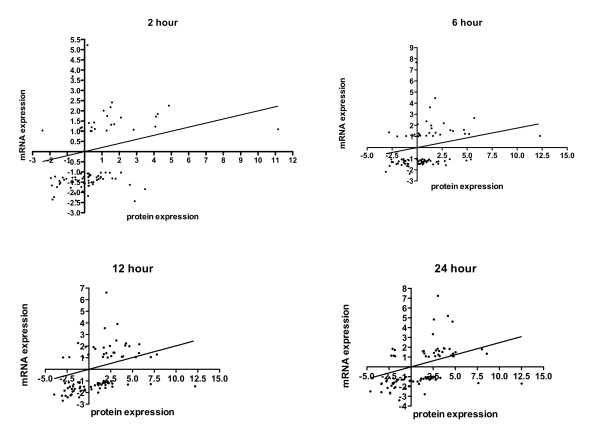
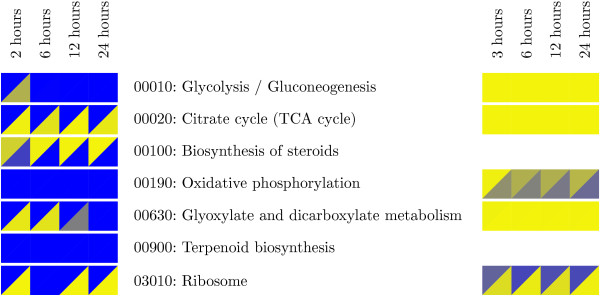
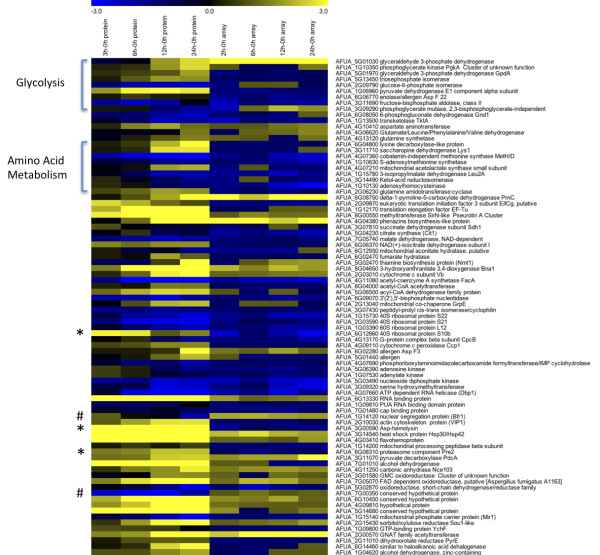
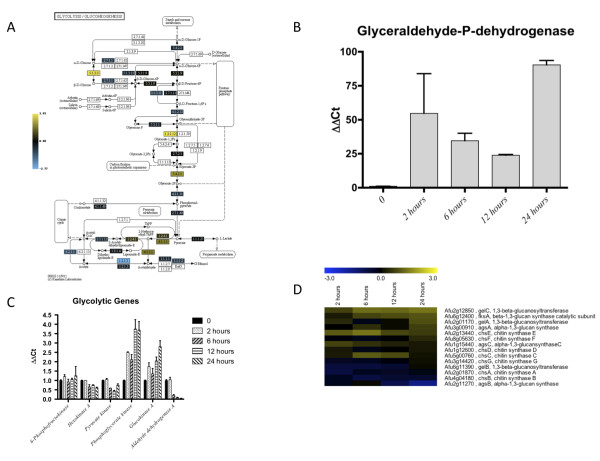
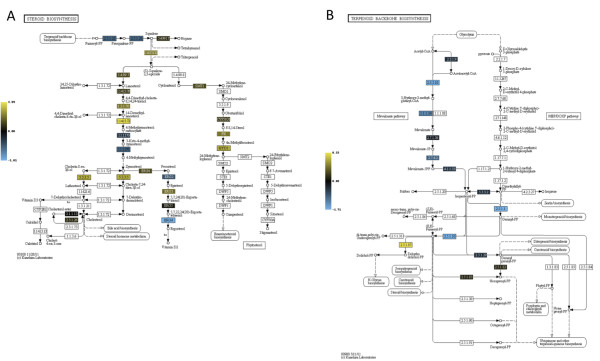
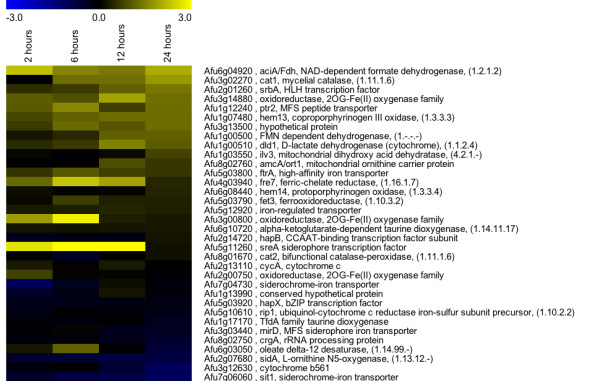
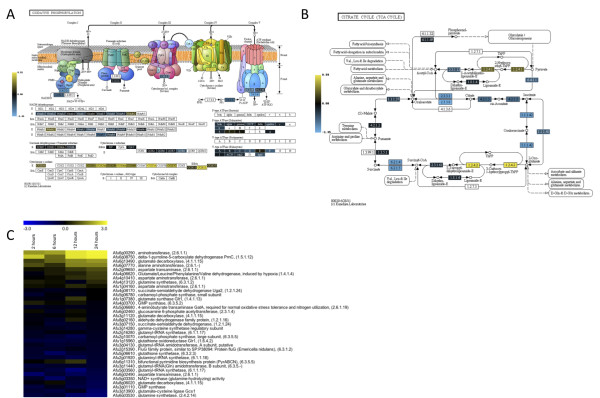
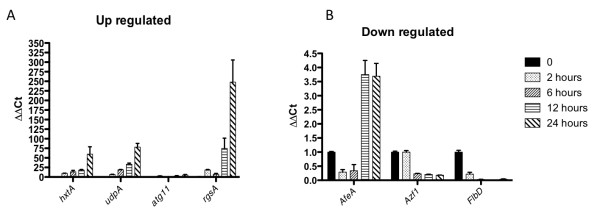
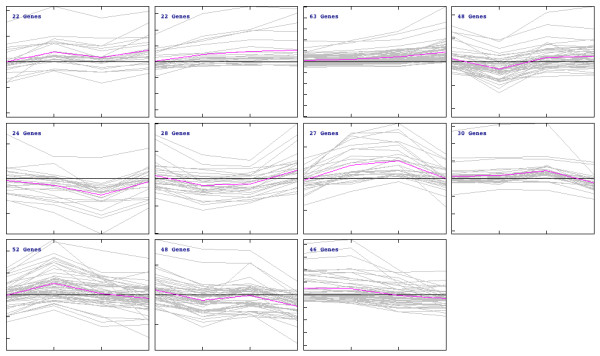
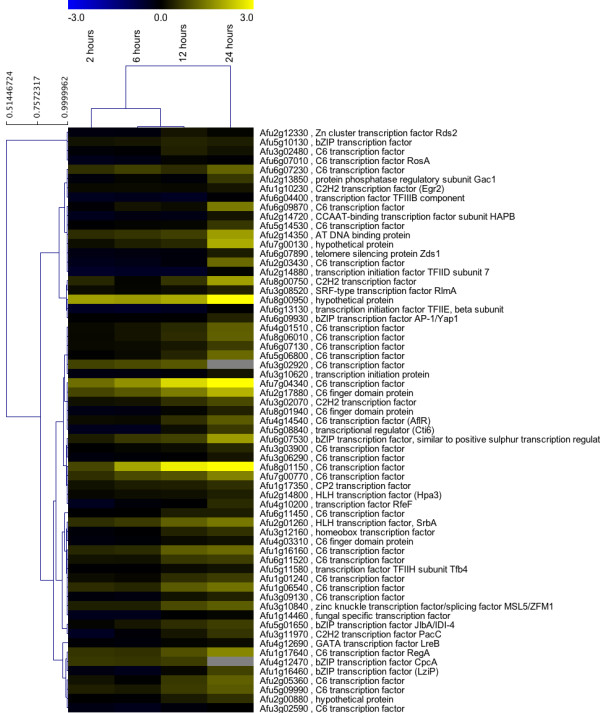
Results: Significant increases in transcripts associated with iron and sterol metabolism, the cell wall, the GABA shunt, and transcriptional regulators were observed in response to hypoxia. A concomitant reduction in transcripts was observed with ribosome and terpenoid backbone biosynthesis, TCA cycle, amino acid metabolism and RNA degradation. Analysis of changes in transcription factor mRNA abundance shows that hypoxia induces significant positive and negative changes that may be important for regulating the hypoxia response in this pathogenic mold. Growth in hypoxia resulted in changes in the protein levels of several glycolytic enzymes, but these changes were not always reflected by the corresponding transcriptional profiling data. However, a good correlation overall (R(2) = 0.2, p < 0.05) existed between the transcriptomic and proteomics datasets for all time points. The lack of correlation between some transcript levels and their subsequent protein levels suggests another regulatory layer of the hypoxia response in A. fumigatus.

Conclusions: Taken together, our data suggest a robust cellular response that is likely regulated both at the transcriptional and post-transcriptional level in response to hypoxia by the human pathogenic mold A. fumigatus. As with other pathogenic fungi, the induction of glycolysis and transcriptional down-regulation of the TCA cycle and oxidative phosphorylation appear to major components of the hypoxia response in this pathogenic mold. In addition, a significant induction of the transcripts involved in ergosterol biosynthesis is consistent with previous observations in the pathogenic yeasts Candida albicans and Cryptococcus neoformans indicating conservation of this response to hypoxia in pathogenic fungi. Because ergosterol biosynthesis enzymes also require iron as a co-factor, the increase in iron uptake transcripts is consistent with an increased need for iron under hypoxia. However, unlike C. albicans and C. neoformans, the GABA shunt appears to play an important role in reducing NADH levels in response to hypoxia in A. fumigatus and it will be intriguing to determine whether this is critical for fungal virulence. Overall, regulatory mechanisms of the A. fumigatus hypoxia response appear to involve both transcriptional and post-transcriptional control of transcript and protein levels and thus provide candidate genes for future analysis of their role in hypoxia adaptation and fungal virulence.


Figures

Figure 1
Figure 1
Analysis of Growth Conditions in Oxygen-controlled Fermenter. A) Growth (increase in mycelial dry weight) and glucose consumption (in g/L) of Aspergillus fumigatus during hypoxic cultivation in an oxygen-controlled fermenter. B) Analysis of the pH and the concentration of D/L-lactate, acetate and ethanol (in mM) in the culture supernatant. Data of three fermentation runs are shown. Three liters of AMM was inoculated with 2 × 10⁹ conidia. After a pre-cultivation period under normoxic growth conditions (21% pO2) oxygen supply was shifted to low oxygen levels (0.21% pO2) and samples were taken after 0, 2 (microarray) or 3 (proteomics), 6, 12 and 24 hours.
Figure 2
Figure 2
Self Organizing Map Analysis (SOMA) of 64 clusters of transcript abundance. This analysis shows 64 clusters of distinct patterns of transcript abundance. The highlighted square is significantly associated with ergosterol biosynthesis and TCA cycle transcripts. The transcript abundance data were clustered with a grid of size 10 × 10 (100 clusters) down to 3 × 3 (9 clusters) using the Pearson correlation coefficient as the metric between transcript profiles. The self-organizing map maximizing the number of clusters while limiting redundancies was the one of size 8 × 8 (64 clusters). Color intensity indicates the number of genes in each cluster.
Figure 3
Figure 3
2D gel electrophoretic separation of protein extracts of A. fumigatus grown under normoxic and hypoxic growth conditions. In total, 86 different proteins of A. fumigatus changed significantly their abundance within the first 24 hours of hypoxia (protein spots are labeled with spot numbers as indicated in Additional file 3 and 5). A. fumigatus proteins were labeled with the CyDye DIGE Fluor minimal dye labeling kit. Subsequently, proteins were separated by 2D gel electrophoresis using immobilized pH gradient strips with a pH range of (A) 3-7 NL and (B) 7-11 NL in the first dimension. For the separation of proteins in the second dimension, SDS-polyacrylamide gradients gels (11-16%) were used. Differentially regulated proteins were identified by MALDI-TOF/TOF analysis. A three color overlaid gel image is shown. Samples were labeled as follows: 0 hour control sample (Cy5), 24 hour hypoxia sample (Cy3) and internal standard (Cy2).
Figure 4
Figure 4
Linear regression of protein level and mRNA level. Slope and regression values are shown for all time points. Values are generally within correlated quadrants. Statistical analysis of the correlation between protein and microarray experiments shows a consistent trend of correlation among the datasets. Linear regressions were forced with X and Y-intercepts at zero, and varied between 0.18 and 0.25, with p < 0.05 for all correlations.
Figure 5
Figure 5
GSEA results for both transcriptomic and proteomic data. KEGG pathways identified as affected by hypoxia are shown. A heat map summarizes the differences and similarities observed between protein (4 columns on left) and transcript data (4 columns on right) for selected pathways. Upper-left triangles are for over-representation of increased transcript levels; lower-right triangles are for over-representation of decreased transcript levels. Yellow indicates significance for over representation, blue indicates that the transcripts are not statistically over-represented.
Figure 6
Figure 6
Heat map comparison of abundance levels for both transcriptomic and proteomic data. Differences and similarities between protein and mRNA levels are shown, blue indicates decreased levels, and yellow indicates increased levels. Data are sorted in the same order as additional file 4 in order of function. Highlighted with brackets are transcripts and proteins associated with glycolysis and amino acid metabolism, which showed different values for transcript and protein abundance. Additional differences are highlighted with # (transcript higher than protein) or * (protein higher that transcript).
Figure 7
Figure 7
Hypoxia affects transcript levels of enzymes involved in glycolysis consistent with fermentation and cell wall components. A. KEGG pathway heat map representation of genes involved in glycolysis. Microarray datasets include three biological and two technical replicates. Microarrays compare wild type Aspergillus fumigatus strain CBS144.89 at the indicated times after exposure to hypoxic conditions to the time point immediately prior to hypoxia exposure (0 hours) using the median value from all replicates. Yellow indicates transcript level is higher in hypoxia. Scale indicates degree of change. B. RT-PCR of Glyceraldehyde-3-phosphate-dehydrogenase supported the observation that this was one of the most abundant hypoxia responsive transcripts in the microarray, as well as in the proteomics analysis. C. Six genes in the glycolysis pathway in Aspergillus fumigatus. Transcript levels of 6-phosophofructokinase, hexokinase A and pyruvate kinase were not dramatically altered. Transcript levels of phosphoglycerate kinase and glucokinase A are 2 to 4-fold increased in response to hypoxia. Aldehyde dehydrogense A transcript level was significantly decreased at 6, 12 and 24 hours. All RT-PCRs were performed on BioRad MyIQ real-time PCR detection system with IQ SYBR green supermix. The ΔΔCt method was used to combine all biological and technical replicates for each transcript, using β-tubulin as the housekeeping gene for comparison. D. Heat map representation of cell wall component transcripts that were compiled from literature [36]. Both microarray datasets include three biological and two technical replicates, and compare wild type Aspergillus fumigatus strain CBS144.89 at the indicated times after exposure to hypoxic conditions to the time point immediately prior to hypoxia exposure (0 hours) using the median value from all replicates. Yellow indicates transcript level is higher in hypoxia.
Figure 8
Figure 8
Hypoxia increases transcript levels of enzymes involved in terpenoid and ergosterol biosynthesis. A. KEGG heat map representation of genes involved in steroid (ergosterol) biosynthesis and B. terpenoid (isoprenoid) biosynthesis. The median value from three biological replicates was used. If multiple transcripts exist for a given enzymatic step (i.e. HmgA and HmgB for 2.3.3.10), the transcript with the highest amplitude was used. Microarray data compares mRNA levels of wild type A. fumigatus at the indicated times after exposure to hypoxic conditions to time point immediately prior to hypoxia exposure (0 hours). Yellow indicates transcript levels are increased compared to normoxia (0 hours). Blue indicates transcript levels are reduced compared to normoxia (0 hours).
Figure 9
Figure 9
Hypoxia increases transcript levels of enzymes involved in heme biosynthesis, iron-associated and SreA-associated processes. Microarray datasets include three biological and two technical replicates to create heat maps using a median values to compare wild type Aspergillus fumigatus strain CBS144.89 at the indicated times after exposure to hypoxia to time point immediately prior to hypoxia exposure (0 hours). Yellow indicates transcript level is higher under exposure to hypoxia. Data are sorted by the late time point (24 hours post exposure to hypoxia).
Figure 10
Figure 10
Hypoxia affects transcript levels of enzymes involved in the tricarboxylic acid (TCA) cycle, oxidative phosphorylation, glutamate biosynthesis and the GABA shunt. A. KEGG heat map representation of genes involved oxidative phosphorylation comparing transcript levels at the indicated times after exposure to hypoxic conditions to time point immediately prior to hypoxia exposure (0 hours). Yellow indicates transcript level is higher. Scale on left indicates intensity of expression. B. KEGG heat map representation of genes involved in the TCA cycle, comparing transcript levels at the indicated times after exposure to hypoxic conditions to time point immediately prior to hypoxia exposure (0 hours). Yellow indicates transcript level is higher. Scale on left indicates intensity of expression. C. Heat map representation of transcripts involved in glutamate biosynthesis, including transcripts associated with the GABA shunt. Both heat maps compare wild type Aspergillus fumigatus strain CBS144.89 at the indicated times after exposure to hypoxic conditions to time point immediately prior to hypoxia exposure (0 hours). Yellow indicates transcript level is higher, and values are sorted by the 24-hour time point.
Figure 11
Figure 11
RT-PCR of novel transcripts affected by hypoxia. A. Four transcripts (Afu3g14170 (hxtA), Afu2g09590 (udpA), Afu3g11590 (atg11), Afu5g00900 (rgsA)) that were significantly increased using real time RT-PCR. B. Three transcripts (Afu5g12510 (afeA), Afu6g05160 (azf1), Afu1g03210 (flbD)), that were significantly decreased using real time RT-PCR. All reactions were performed on BioRad MyIQ real-time PCR detection system with IQ SYBR green supermix. The ΔΔCt method was used to combine three biological and 2 technical replicates for each transcript, using β-tubulin as the housekeeping gene for comparison.
Figure 12
Figure 12
Self organizing tree algorithm (SOTA) clusters of transcription factor transcript levels in response to hypoxia. Eleven clusters were identified in MeV using the SOTA function. Grey lines are the individual transcription factor transcript level, and pink is the average trend line for a given cluster. The majority of transcripts are not associated with a pathway, and therefore no significant categories, other than DNA binding, were detected among the clusters. Each tick mark on the X-axis represents each time point in the experiment, and each tick mark on the Y-axis represents a fold change in transcript level. The box marked with an asterisk represents the cluster containing the known hypoxia responsive transcription factor, SrbA. These transcripts are further evaluated in Figure 13.
Figure 13
Figure 13
Self-organizing tree algorithm (SOTA) cluster associated with the transcription factor SrbA. A hierarchical tree generated from the median transcript levels of 63 transcription factors showing a similar transcript level profile with a known hypoxia responsive transcription factor SrbA identified from the SOTA analysis in Figure 12. Microarray datasets include three biological and two technical replicates. Microarrays compare wild type Aspergillus fumigatus strain CBS144.89 at the indicated times after exposure to hypoxic conditions to the time point immediately prior to hypoxia exposure (0 hours). Yellow indicates transcript level is higher in hypoxia.

References

    1. Perlroth J, Choi B, Spellberg B. Nosocomial fungal infections: epidemiology, diagnosis, and treatment. Med Mycol. 2007;45:321–346. - PubMed
    1. Gurcan S, Tikvesli M, Eryildiz C, Evci C, Ener B. Antifungal susceptibilities of Aspergillus spp. strains isolated from invasive aspergillosis cases. Mikrobiyoloji Bulteni. 2010;44:273–278. - PubMed
    1. Barron MA, Madinger NE. Opportunistic fungal infections, part 2: Candida and Aspergillus. Infect Med. 2008;25:498–505.
    1. Howard SJ, Pasqualotto AC, Denning DW. Azole resistance in allergic bronchopulmonary aspergillosis and Aspergillus bronchitis. Clin Microbiol Infect. 2010;16:683–688. - PubMed
    1. Bonatti H, Lass-Floerl C, Angerer K, Singh N, Lechner M, Stelzmueller I, Singh R, Schmid T, Geltner C. Successful management of postpneumonectomy Aspergillus pleural empyema by combined surgical and anti-fungal treatment with voriconazole and caspofungin. Mycoses. 2010;53:448–454. - PubMed

Publication types

MeSH terms