. 2012 Feb 6:9:5.
doi: 10.1186/1742-4682-9-5.

Dysmorphometrics: the modelling of morphological abnormalities

Affiliations

Dysmorphometrics: the modelling of morphological abnormalities

Peter Claes et al. Theor Biol Med Model. .

Abstract

Background: The study of typical morphological variations using quantitative, morphometric descriptors has always interested biologists in general. However, unusual examples of form, such as abnormalities are often encountered in biomedical sciences. Despite the long history of morphometrics, the means to identify and quantify such unusual form differences remains limited.

Methods: A theoretical concept, called dysmorphometrics, is introduced augmenting current geometric morphometrics with a focus on identifying and modelling form abnormalities. Dysmorphometrics applies the paradigm of detecting form differences as outliers compared to an appropriate norm. To achieve this, the likelihood formulation of landmark superimpositions is extended with outlier processes explicitly introducing a latent variable coding for abnormalities. A tractable solution to this augmented superimposition problem is obtained using Expectation-Maximization. The topography of detected abnormalities is encoded in a dysmorphogram.

Results: We demonstrate the use of dysmorphometrics to measure abrupt changes in time, asymmetry and discordancy in a set of human faces presenting with facial abnormalities.

Conclusion: The results clearly illustrate the unique power to reveal unusual form differences given only normative data with clear applications in both biomedical practice & research.


Figures

Figure 1
Figure 1
The Pinocchio effect. The Pinocchio effect known in shape analysis, is the large change of limited features or landmarks in an object or organism. (a) Pinocchio honest. (b) Pinocchio lying. The tip of the Nose grows forward by an amount of 30 mm. (c) Local landmark superimposition differences after a LSS superimposition or Procrustes-fit of (b) onto (a). The color-scale ranges from 0 mm (white) to 2 mm (dark red) to more than 2 mm (black) difference. Note the smearing out effect of the 'affected' landmarks in the nose onto the 'unaffected' landmarks on the rest of the face after superimposition. (d) Same after robust superimposition of (b) onto (a). Note the perfect alignment of 'unaffected' landmarks. (d) Also depicts the dysmorphogram using a color-scale such that everything except white reflects outliers to some degree with black being the strongest outliers.
Figure 2
Figure 2
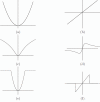
M-estimators. Different M-estimators (left column) and their outlier influence functions (right column). (a,b) The Quadratic M-estimator, (c,d) The Lorentzian estimator and (e,f) The Truncated Quadratic. The original Quadratic has a linear increasing outlier influence without bound, while both the Lorentzian and the Truncated Quadratic have interesting saturating properties.
Figure 3
Figure 3
Equivalent M-estimator. Equivalent M-estimator and outlier influence functions for the augmented superimposition with AWGN modelling (a) and (b) with σ = 1 and κ = 2. (c) and (d) similarly but for σ = 1 and κ = 1, 2, 3 or equivalently κ = 2 and σ = 0.5, 1, 1.5 values, suggesting automatic adaptation of the M-estimator in function of the inlier-distribution or typical variation.
Figure 4
Figure 4
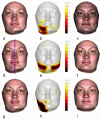
Facial form change, asymmetry and discordancy. Facial form change, asymmetry and discordancy of a 19 year old woman with a right hemimandibular hypertrophy. Top Row: Assessment of facial change due to surgical intervention. (a) Pre-surgical facial surface, representing the norm. (b) Dysmorphogram of facial change, depicting the features that changed. (c) Post-surgical facial surface. Middle Row: Assessment of facial asymmetry. (d) Original facial surface being the norm. With a robustly obtained mid-facial line (blue) and skewed symmetry line (red) obtained with an original Procrustes-fit. (e) Dysmorphogram of facial asymmetry, depicting the asymmetrical features. (f) Mirrored facial surface, according to the blue mid-facial line. Bottom Row: Assessment of facial discordancy (g) Pre-surgical facial surface to assess (i) Norm-equivalent of the Pre-surgical facial surface, being the norm (h) Dysmorphogram of facial discordancy, depicting the features that are considered abnormal compared to a normative reference population.
Figure 5
Figure 5
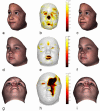
Facial discordancy of craniofacial disorders & syndromes. From left to right: original facial surface, dysmorphogram of facial discordancy and norm-equivalent. From top to bottom: assessment of persons with mild Treacher-Collins syndrome, a Lysosomal Storage Disorder and a Parry-Romberg syndrome. A general note: eyes and areas in the face covered by hair, e.g. eyebrows, always contain 3D surface mesh-artifacts (due to limitations of current scanning technology) such that spurious outliers are visible in these areas. These are to be interpreted with caution.
Figure 6
Figure 6
Time Complexity. Time complexity analysis of the Ext-P ML-estimator in function of the amount of landmarks against the resistant-fit (left) and Least Sum of Squares Procrustes ML-estimator (right).
Figure 7
Figure 7
Superimposition differences. The difference, expressed as an Euclidean Distance between resulting landmark configurations, between the Ext-P ML-estimator solutions for varying values of κ and the Least Sum of Squares Procrustes ML-estimator solution, using the surgical intervention superimposition of Figure 4 (a-c).
Figure 8
Figure 8
Distribution of local form differences and overlaying estimated model. Resulting distributions and overlaying AWGN model of the practical Ext-P ML-estimator for local form differences found on the three types of facial assessment for the subject illustrated in Figure 4. Top to Bottom: abrupt change due to surgical intervention, asymmetry and discordancy. Left Collumn: robust superimposition results using κ = 2. Right Collumn: unweighted superimposition results using κ = 6 (mimicking the LSS Procrustes ML-estimator as demonstrated in Figure 7). The tighter the fit of the model onto the main peak of the distribution the better the model describes true differences in form.

Similar articles

Cited by

References

    1. Blackith R, Reyment R. Multivariate Morphometrics. New York: Academic Press; 1971.
    1. Penrose L. Distance, size and shape. Annals of Eugenics. 1954;18:337–343. - PubMed
    1. Lestrel P. Morphometrics for the life sciences Volume 7 of Recent advances in human biology. World Scientific Publishing Co. Pte. Ltd; 2000.
    1. Zelditch M, Swiderski D, Sheets H, Fink W. Geometric morphometrics for biologists: A primer. New York and London: Elsevier Academic Press; 2004.
    1. Richtsmeier JT, Deleon VB. Morphological integration of the skull in craniofacial anomalies. Orthodontics and Craniofacial Research. 2009;12:149–158. doi: 10.1111/j.1601-6343.2009.01448.x. - DOI - PMC - PubMed

Publication types

LinkOut - more resources