Review
. 2012 Jun;17(2):228-43.
doi: 10.1037/a0027127. Epub 2012 Feb 6.

Model selection and psychological theory: a discussion of the differences between the Akaike information criterion (AIC) and the Bayesian information criterion (BIC)

Affiliations
Review

Model selection and psychological theory: a discussion of the differences between the Akaike information criterion (AIC) and the Bayesian information criterion (BIC)

Scott I Vrieze. Psychol Methods. 2012 Jun.

Abstract

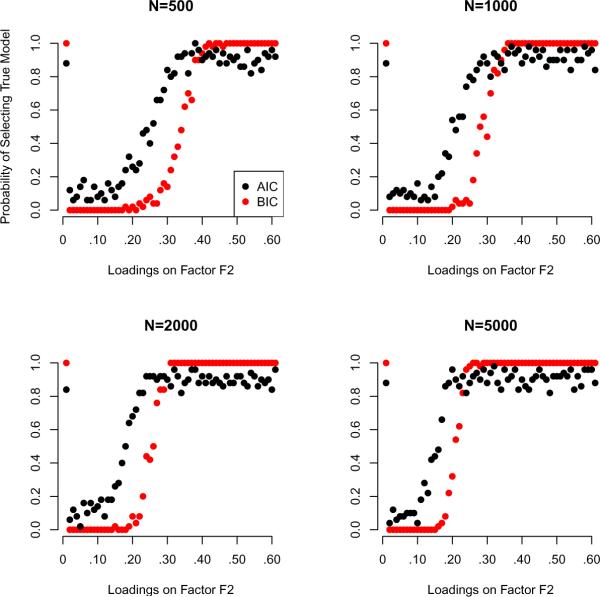
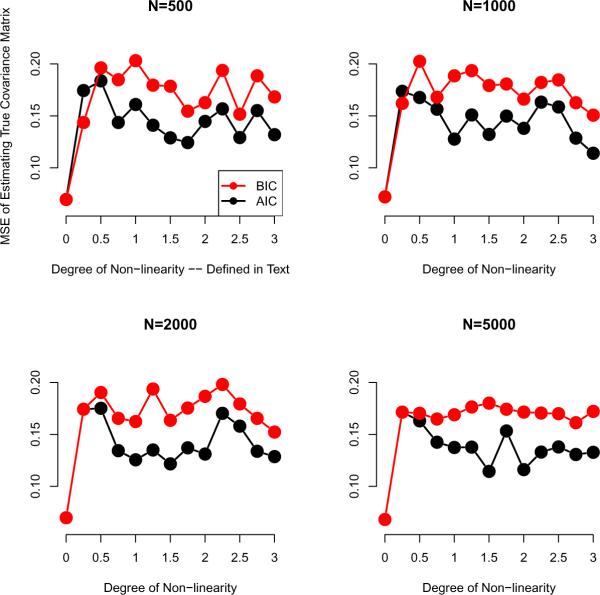
This article reviews the Akaike information criterion (AIC) and the Bayesian information criterion (BIC) in model selection and the appraisal of psychological theory. The focus is on latent variable models, given their growing use in theory testing and construction. Theoretical statistical results in regression are discussed, and more important issues are illustrated with novel simulations involving latent variable models including factor analysis, latent profile analysis, and factor mixture models. Asymptotically, the BIC is consistent, in that it will select the true model if, among other assumptions, the true model is among the candidate models considered. The AIC is not consistent under these circumstances. When the true model is not in the candidate model set the AIC is efficient, in that it will asymptotically choose whichever model minimizes the mean squared error of prediction/estimation. The BIC is not efficient under these circumstances. Unlike the BIC, the AIC also has a minimax property, in that it can minimize the maximum possible risk in finite sample sizes. In sum, the AIC and BIC have quite different properties that require different assumptions, and applied researchers and methodologists alike will benefit from improved understanding of the asymptotic and finite-sample behavior of these criteria. The ultimate decision to use the AIC or BIC depends on many factors, including the loss function employed, the study's methodological design, the substantive research question, and the notion of a true model and its applicability to the study at hand.


Figures

Figure 1
Figure 1
AIC and BIC performance in selecting the true model, when the true model's effect sizes range from very small to large. The effect size is a factor loading that varies from zero to .6. Thus, the factor F2 loading along the x-axis is the true loading. When the loading is zero, then the true model is a one-factor model, and BIC outperforms the AIC in selecting the one factor model (this occurs once in each panel). When the loading is nonzero the true model is a two-factor model, and plotted here is the probability that the AIC (or BIC) selected the two-factor model. Despite the BIC's consistency property, the AIC outperforms it for a range of loadings.
Figure 2
Figure 2
AIC and BIC performance in minimizing mean squared error of estimating the true covariance matrix (in the upper array of four plots). These plots are created from the same simulation used to create Figure 1. Notice that the BIC outperforms the AIC for lower loading values. For lower loading values the BIC is selecting the one-factor model but the AIC is selecting the two-factor model (as can be seen in Figure 1). This is due to the higher penalty of log(N) that the BIC places on the more complex two-factor model. The upshot is that the BIC ignores the effect of these very small loadings by selecting the one factor model. This works in its favor because it outperforms the AIC in MSE. As the loadings of the data-generating two-factor model increase the BIC persists in selecting the one-factor model to its detriment, and the AIC begins outperforming it in MSE. This occurs up to the point where the loadings are too large for the BIC to ignore, and it begins outperforming the AIC again because it starts selects the true, two-factor model, every time, whereas the AIC errs at times and selects the three factor model. In the lower array is plotted the relative risk in mean squared error, which is a re-expression of the information in the top array of panels. It is simply the AIC minus the minimum of the AIC and BIC (plotted in black) or BIC minus the minimum of the AIC or BIC (plotted in red). The BIC yields the maximum possible risk in each sample size (has the highest value in each of the lower array of plots), whereas the AIC minimizes the maximum possible risk. Each plot had a loess smoother with a small span applied, to aid in visual interpretation.
Figure 3
Figure 3
Scatterplot matrix of observed data for the non-linear simulation when x = 1, where x is the degree of nonlinearity described in the text. Correlations range from about .3 to about .8. The red lines are loess-smoothed regressions, and indicate the extent to which the regression is non-linear.
Figure 4
Figure 4
AIC and BIC performance when the true model is not in the candidate model set. The risk function here is minimizing mean squared error of estimating the true covariance matrix under increasing amounts of non-linearity. When the data is linear (degree of non-linearity is zero) the AIC and BIC perform equally well. For small amounts of non-linearity the BIC outperforms the AIC for N = 500 and N = 1000 because the AIC is overly sensitive to inconsequential small true effects. As the degree of non-linearity increases the BIC persists in underfitting (selecting the one-factor model) much to its detriment, as the AIC begins outperforming it in MSE. See text for details on how the non-linearity was manipulated. Each dot represents an average MSE for 50 replications.

Similar articles

Cited by

References

    1. Akaike H. A new look at the statistical model identification. IEEE Transactions on Automatic Control. 1974;19:716–723.
    1. Anderson D, Burnham K. Avoiding pitfalls when using information-theoretic methods. Journal of Wildlife Management. 2002;66:912–918.
    1. Atkinson A. A note on the generalized information criterion for choice of a model. Biometrika. 1980;67:413–418.
    1. Atkinson A. Likelihood ratios, posterior odds, and information criteria. Journal of Econometrics. 1981;16:15–20.
    1. Barron A, Birgé L, Massart P. Risk bounds for model selection by penalization. Probability Theory and Related Fields. 1999;113:301–413.

Publication types