. 2012 Jul;69(13):2245-60.
doi: 10.1007/s00018-012-0925-5. Epub 2012 Feb 5.

SIRT1 modulates MAPK pathways in ischemic-reperfused cardiomyocytes

Affiliations

SIRT1 modulates MAPK pathways in ischemic-reperfused cardiomyocytes

Matteo Becatti et al. Cell Mol Life Sci. 2012 Jul.

Abstract

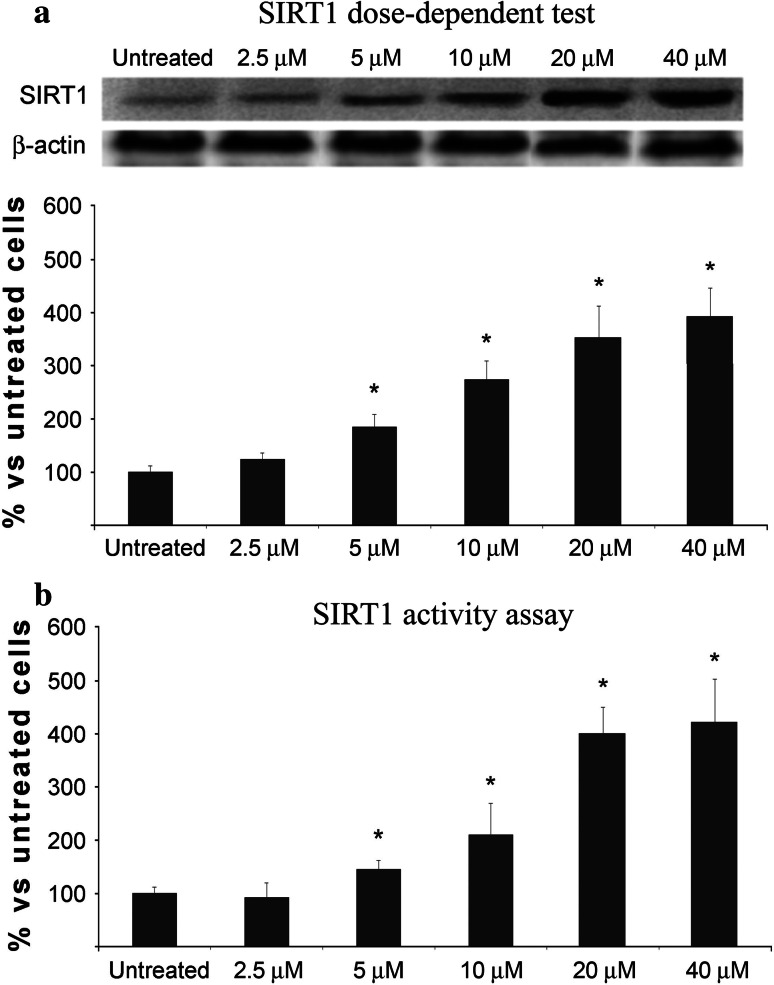
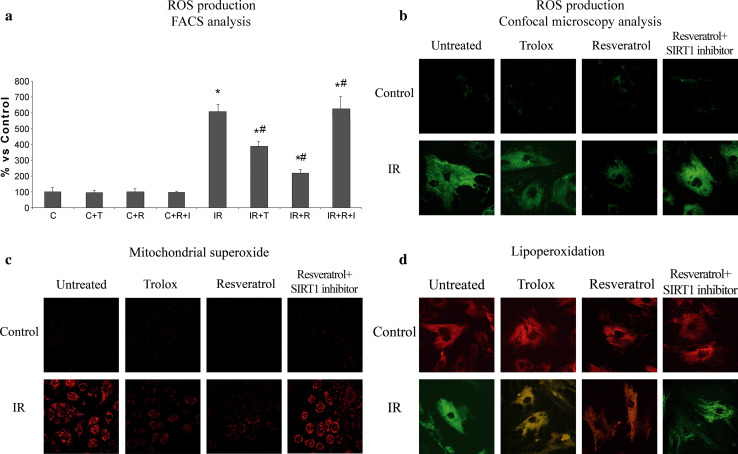
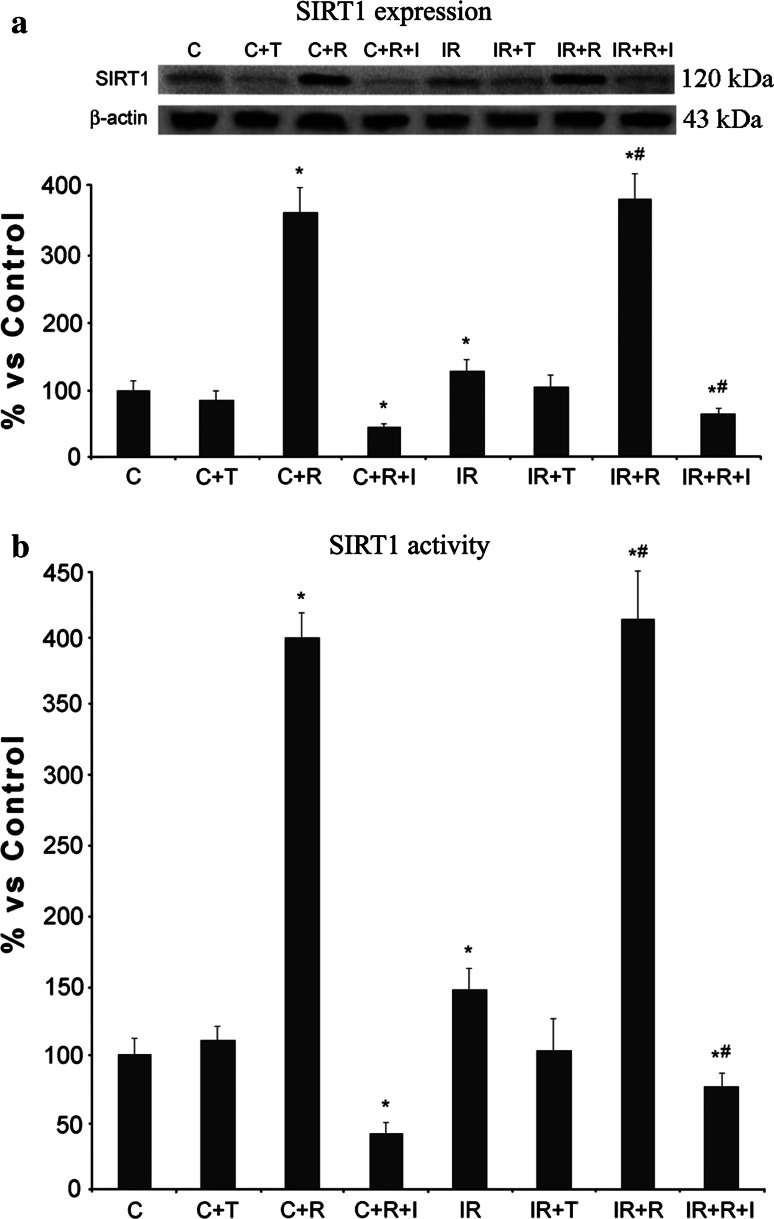
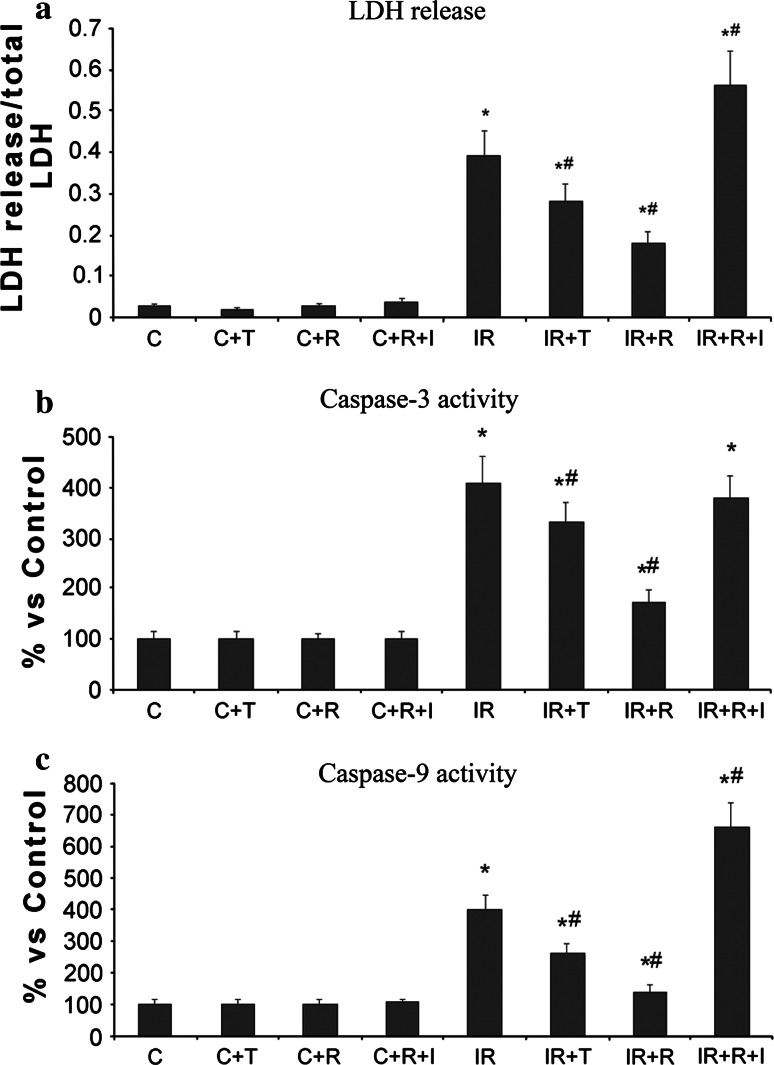
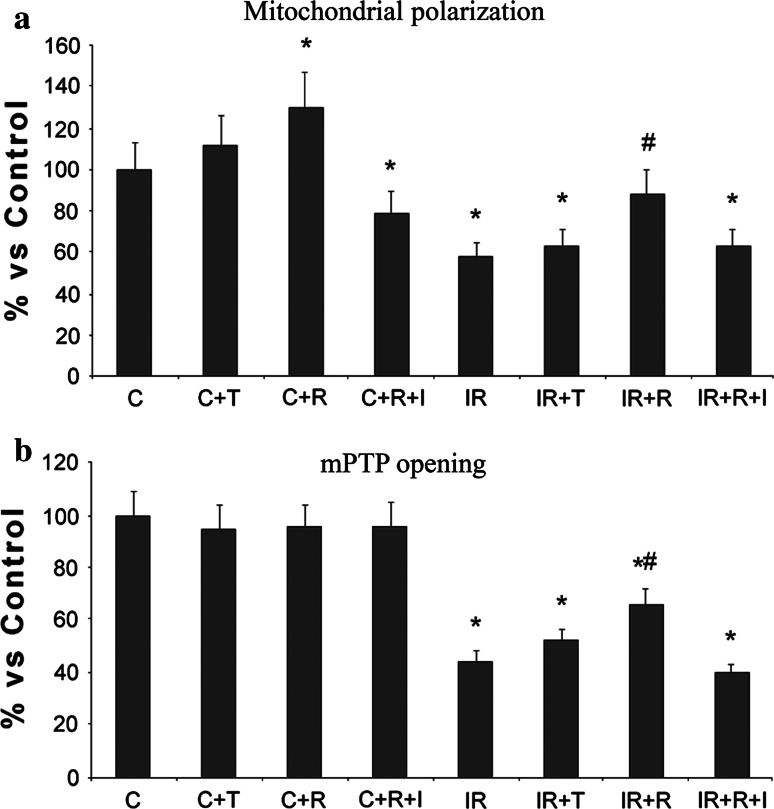
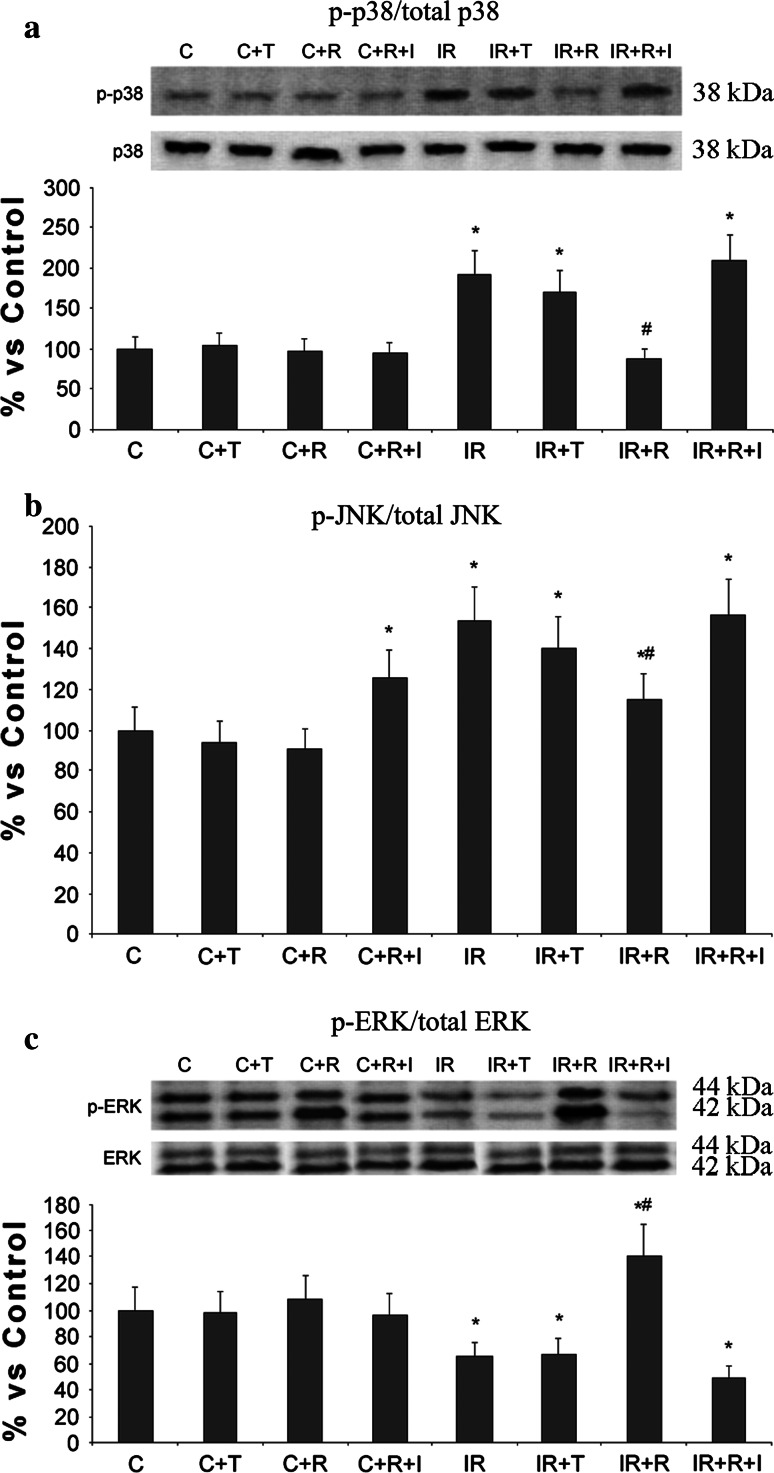
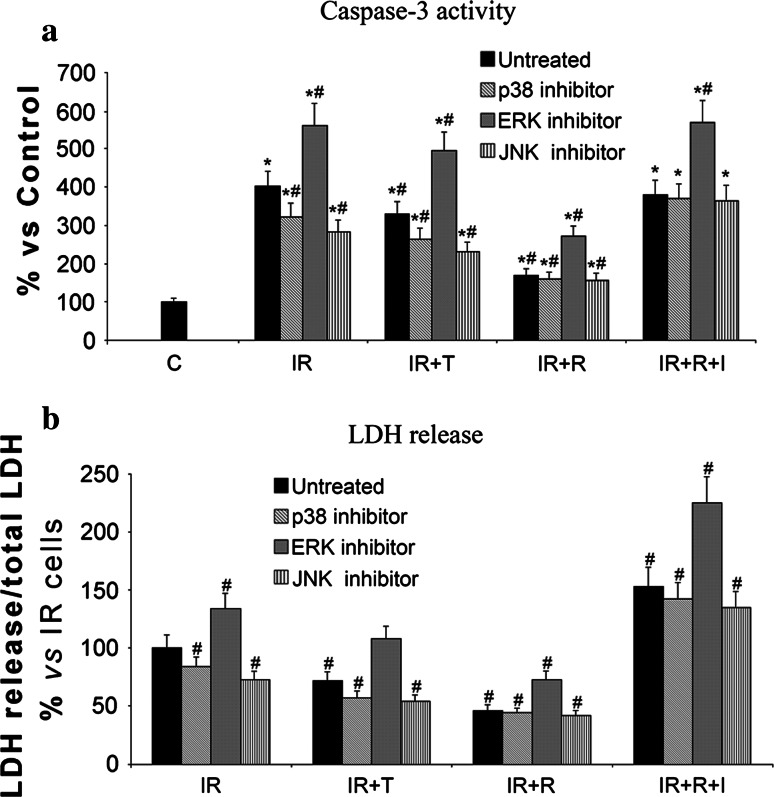
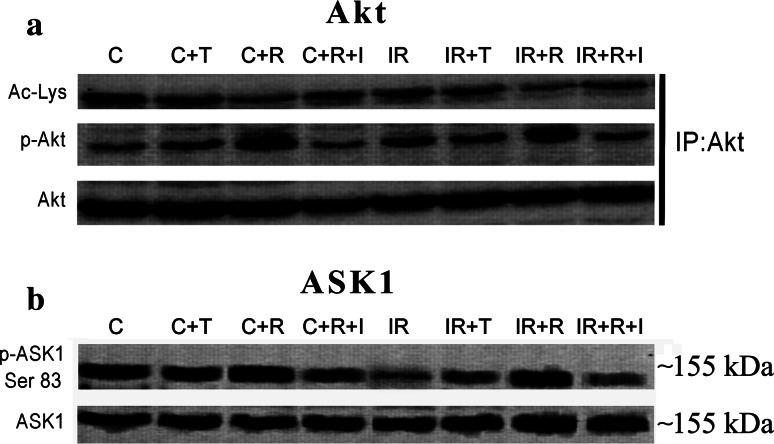
SIRT1, an ubiquitous NAD(+)-dependent deacetylase that plays a role in biological processes such as longevity and stress response, is significantly activated in response to reactive oxygen species (ROS) production. Resveratrol (Resv), an important activator of SIRT1, has been shown to exert major health benefits in diseases associated with oxidative stress. In ischemia-reperfusion (IR) injury, a major role has been attributed to the mitogen-activated protein kinase (MAPK) pathway, which is upregulated in response to a variety of stress stimuli, including oxidative stress. In neonatal rat ventricular cardiomyocytes subjected to simulated IR, the effect of Resv-induced SIRT1 activation and the relationships with the MAPK pathway were investigated. Resv-induced SIRT1 overexpression protected cardiomyocytes from oxidative injury, mitochondrial dysfunction, and cell death induced by IR. For the first time, we demonstrate that SIRT1 overexpression positively affects the MAPK pathway-via Akt/ASK1 signaling-by reducing p38 and JNK phosphorylation and increasing ERK phosphorylation. These results reveal a new protective mechanism elicited by Resv-induced SIRT1 activation in IR tissues and suggest novel potential therapeutic targets to manage IR-induced cardiac dysfunction.


Figures

Fig. 1
Fig. 1
SIRT1 expression (a) and activity (b) in neonatal rat ventricular cardiomyocytes after 24 h of incubation with different concentrations of Resv. In Western-blot analysis, all signals were quantified by densitometric analysis and are expressed as ratio of SIRT1 densitometry on β-actin (loading control) densitometry. *Significant difference (p ≤ 0.05) versus untreated cells. The reported values (mean ± SD) are representative of four independent experiments, each performed in triplicate
Fig. 2
Fig. 2
a FACS analysis of ROS production by H2DCFDA fluorescence in control normoxic (C) and in IR neonatal rat ventricular cardiomyocytes in the presence of Resv (R), Trolox (T), or SIRT1 inhibitor (I). *Significant difference (p ≤ 0.05) versus control (C) cells. #Significant difference (p ≤ 0.05) versus IR cells. b Confocal microscope analysis of ROS production (63× magnification). c Mitochondrial superoxide (20× magnification), and d lipoperoxidation (63× magnification) in IR neonatal rat ventricular cardiomyocytes. The reported values (mean ± SD) are representative of five independent experiments, each performed in triplicate
Fig. 3
Fig. 3
SIRT1 expression a and activity b in IR neonatal rat ventricular cardiomyocytes. In western blot analysis all signals were quantified by densitometric analysis and were expressed as a ratio of SIRT1 densitometry versus β-actin (loading control) densitometry. *Significant difference (p ≤ 0.05) versus untreated cells. #Significant difference (p ≤ 0.05) versus IR cells. Control normoxic cells (C), Resv (R), Trolox (T), SIRT1 inhibitor (I). The reported values (mean ± SD) are representative of four independent experiments, each performed in triplicate
Fig. 4
Fig. 4
a Release of cellular LDH into the culture media measured by spectrofluorimetric analysis, b the caspase-3, and c caspase-9 activities measured by flow cytometry assayed in IR neonatal rat ventricular cardiomyocytes. *Significant difference (p ≤ 0.05) versus control cells. #Significant difference (p ≤ 0.05) versus IR cells. Control normoxic cells (C), Resv (R), Trolox (T), SIRT1 inhibitor (I). The reported values (mean ± SD) are representative of four independent experiments, each performed in triplicate
Fig. 5
Fig. 5
a Mitochondrial depolarization and b mitochondrial permeability transition pore opening measured by flow cytometry in IR neonatal rat ventricular cardiomyocytes. *Significant difference (p ≤ 0.05) versus control cells. #Significant difference (p ≤ 0.05) versus IR cells. Control normoxic cells (C), Resv (R), Trolox (T), SIRT1 inhibitor (I). The reported values (mean ± SD) are representative of four independent experiments, each performed in triplicate
Fig. 6
Fig. 6
MAPK phosphorylation in IR neonatal rat ventricular cardiomyocytes. a Western-blot analysis of phosphorylated p38 expression. All signals were quantified by densitometric analysis and were expressed as a ratio of p-p38 densitometry versus total p38 (loading control) densitometry. b Quantification of total and phosphorylated c-Jun N-terminal kinase by ELISA. c Western-blot analysis of phosphorylated ERK expression. All signals were quantified by densitometric analysis and were expressed as a ratio of p-ERK densitometry versus total ERK (loading control) densitometry. *Significant difference (p ≤ 0.05) versus control cells. #Significant difference (p ≤ 0.05) versus IR cells. Control normoxic cells (C), Resv (R), Trolox (T), SIRT1 inhibitor (I). The reported values (mean ± SD) are representative of four independent experiments, each performed in triplicate
Fig. 7
Fig. 7
a Caspase-3 activity measured using flow cytometry and b the release of cellular LDH into the culture media assayed in IR neonatal rat ventricular cardiomyocytes in the presence of specific MAPK inhibitors. *Significant difference (p ≤ 0.05) versus control cells. #Significant difference (p ≤ 0.05) versus IR cells. Control normoxic cells (C), Resv (R), Trolox (T), SIRT1 inhibitor (I). The reported values (mean ± SD) are representative of four independent experiments, each performed in triplicate
Fig. 8
Fig. 8
a The phosphorylation and acetylation status of Akt immunoprecipitated from neonatal rat ventricular cardiomyocytes determined by immunoblotting. b Western-blot analysis of ASK1 phosphorylation at Ser83 in neonatal rat ventricular cardiomyocytes. Control normoxic cells (C), Resv (R), Trolox (T), SIRT1 inhibitor (I). The reported values (mean ± SD) are representative of four independent experiments, each performed in triplicate

References

    1. Murphy E, Steenbergen C. Mechanisms underlying acute protection from cardiac ischemia-reperfusion injury. Physiol Rev. 2008;88:581–609. doi: 10.1152/physrev.00024.2007. - DOI - PMC - PubMed
    1. Braunersreuther V, Jaquet V. Reactive oxygen species in myocardial reperfusion injury: from physiopathology to therapeutic approaches. Curr Pharm Biotechnol. 2012;13:97–114. doi: 10.2174/138920112798868782. - DOI - PubMed
    1. Kyriakis JM, Avruch J. Mammalian mitogen-activated protein kinase signal transduction pathways activated by stress and inflammation. Physiol Rev. 2001;81:807–869. - PubMed
    1. Alcendor RR, Gao S, Zhai P, Zablocki D, Holle E, Yu X, Tian B, Wagner T, Vatner SF, Sadoshima J. Sirt1 regulates aging and resistance to oxidative stress in the heart. Circ Res. 2007;100:1512–1521. doi: 10.1161/01.RES.0000267723.65696.4a. - DOI - PubMed
    1. Jeong J, Juhn K, Lee H, Kim SH, Min BH, Lee KM, Cho MH, Park GH, Lee KH. SIRT1 promotes DNA repair activity and deacetylation of Ku70. Exp Mol Med. 2007;39:8–13. - PubMed

Publication types

MeSH terms