. 2012 Mar 19;367(1590):868-77.
doi: 10.1098/rstb.2011.0299.

Genome-wide scans provide evidence for positive selection of genes implicated in Lassa fever

Affiliations

Genome-wide scans provide evidence for positive selection of genes implicated in Lassa fever

Kristian G Andersen et al. Philos Trans R Soc Lond B Biol Sci. .

Abstract

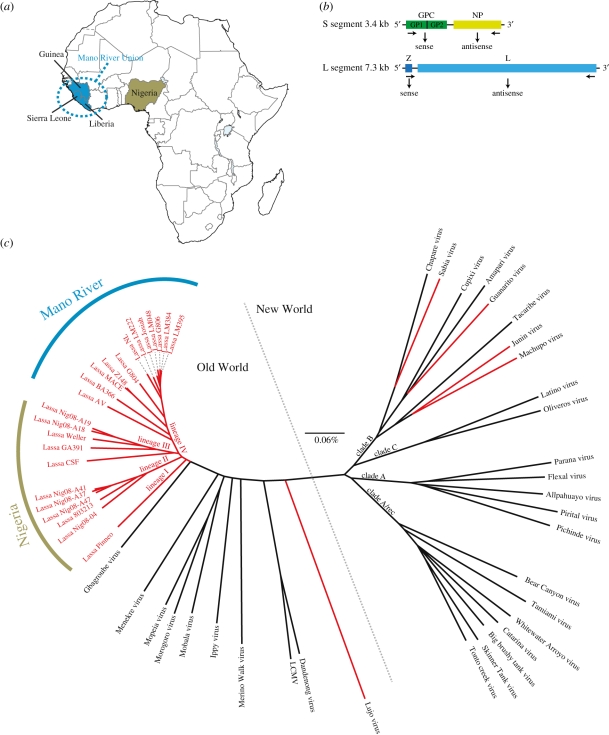
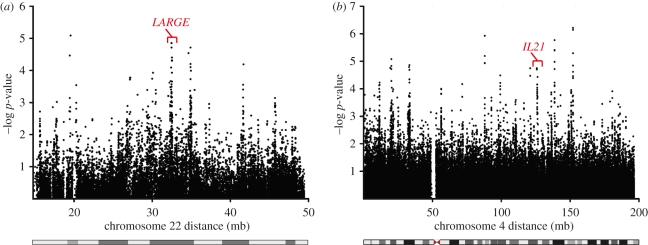
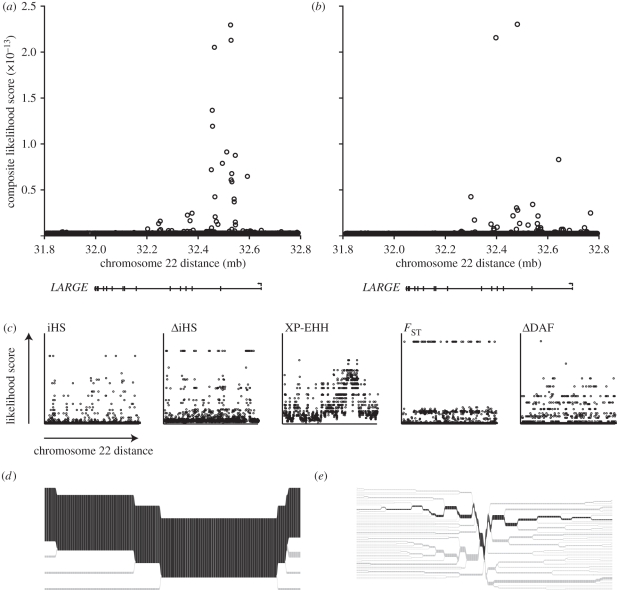
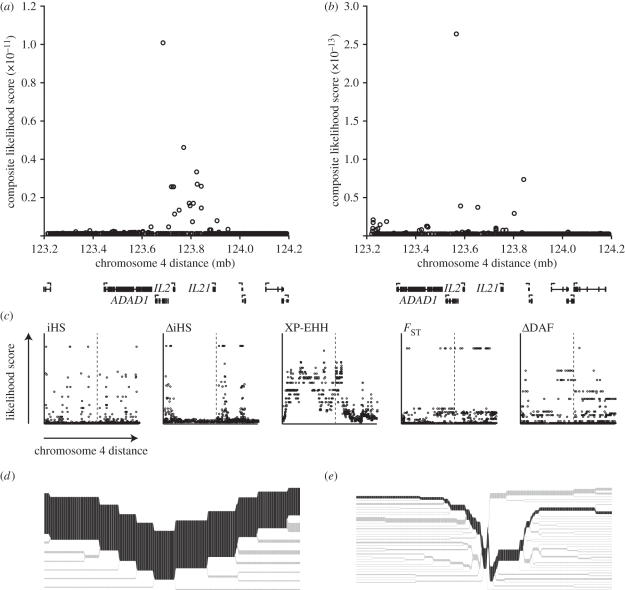
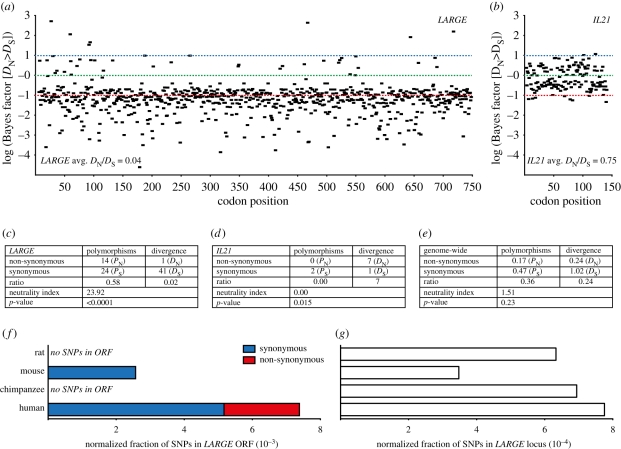
Rapidly evolving viruses and other pathogens can have an immense impact on human evolution as natural selection acts to increase the prevalence of genetic variants providing resistance to disease. With the emergence of large datasets of human genetic variation, we can search for signatures of natural selection in the human genome driven by such disease-causing microorganisms. Based on this approach, we have previously hypothesized that Lassa virus (LASV) may have been a driver of natural selection in West African populations where Lassa haemorrhagic fever is endemic. In this study, we provide further evidence for this notion. By applying tests for selection to genome-wide data from the International Haplotype Map Consortium and the 1000 Genomes Consortium, we demonstrate evidence for positive selection in LARGE and interleukin 21 (IL21), two genes implicated in LASV infectivity and immunity. We further localized the signals of selection, using the recently developed composite of multiple signals method, to introns and putative regulatory regions of those genes. Our results suggest that natural selection may have targeted variants giving rise to alternative splicing or differential gene expression of LARGE and IL21. Overall, our study supports the hypothesis that selective pressures imposed by LASV may have led to the emergence of particular alleles conferring resistance to Lassa fever, and opens up new avenues of research pursuit.


Figures

Figure 1.
Figure 1.
Lassa virus (LASV) is a highly divergent haemorrhagic fever-causing virus endemic to West Africa. (a) Map of Lassa haemorrhagic fever (LF) endemic countries. (b) The LASV genome consists of two RNA segments that encode four proteins using an ambisense strategy. The S segment codes for the nucleoprotein NP, as well the glycoprotein precursor GPC that is cleaved to the glycoproteins GP1 and GP2. The L segment contains the zinc-binding protein Z and the viral RNA-dependent RNA polymerase L. (c) LASV belongs to the highly divergent arenavirus family that is divided into ‘Old World’ arenaviruses mostly found in Africa and the ‘New World’ arenaviruses primarily found in South America. Representative full-length S segments from all known arenaviruses were aligned and a bootstrapped (1000 repetitions) phylogenetic tree was constructed using neighbour-joining [16]. Haemorrhagic fever-causing viruses are shown in red. Nucleotide divergence is indicated in the scale bar.
Figure 2.
Figure 2.
Chromosome-wide detection of positive selection at the LARGE and IL21 loci in Yorubans from West Africa (YRI). (a,b) iHS scores were calculated from the HapMap II dataset and the −log p-values for the event that a SNP is under positive selection are shown [9].
Figure 3.
Figure 3.
The signal of selection within LARGE localizes to the first two introns. (a,b) Composite of multiple signal-likelihood scores [11] were calculated in a 1 mb region of chromosome 22 using (a) HapMap II data (NCBI36/hg17 assembly) or (b) 1000 G data (NCBI36/hg18 assembly). (c) Likelihood scores of the individual tests that form the basis for CMS were plotted within the same region using 1000 G data. (d,e) Bifurcation diagrams [29] showing the extent of haplotype breakdown surrounding a putative selected allele at LARGE for the (d) derived and (e) ancestral allele in Yorubans from West Africa. The diagrams were created for the SNP with the highest value of iHS in the CMS top-scoring SNPs. The proposed ancestral (most abundant) haplotype on which the allele arose is shown in dark grey, whereas branch points are shown in light grey.
Figure 4.
Figure 4.
The signal of selection around the IL21 locus. (a,b) Composite of multiple signal-likelihood scores [11] were calculated in a 1 mb region of chromosome 4 using (a) HapMap II data (NCBI36/hg17 assembly) or (b) 1000 G data (NCBI36/hg18 assembly). (c) Likelihood scores of the individual tests that form the basis for CMS were plotted within the same region using 1000 G data (dotted line, IL21 locus). (d,e) Bifurcation diagrams [29] showing the extent of haplotype breakdown surrounding a putative selected allele at IL21 for the (d) derived and (e) ancestral allele in Yorubans from West Africa. The diagrams were created for the SNP with the highest value of iHS in the CMS top-scoring SNPs. The proposed ancestral (most abundant) haplotype on which the allele arose is shown in dark grey, whereas branch points are shown in light grey.
Figure 5.
Figure 5.
The open reading frames (ORFs) of LARGE and IL21 show evidence of purifying and positive selection. (a,b) The ORFs from mammalian LARGE and IL21 were codon-aligned and the ratio of non-synonymous (DN) to synonymous (DS) mutations were counted and the ratio between the two calculated. A log Bayes factor providing statistical support for DN > DS at individual sites was calculated using the random effects likelihood test implemented at the Datamonkey website [31]. Cutoff values for positive, neutral and purifying (negative) selection are marked on the diagrams in blue, green and red, respectively. (c–e) McDonald–Kreitman tests comparing the amount of polymorphisms in LARGE and IL21 to that of the divergence in these genes between humans and macaques [32,33]. (e) Results were compared with the genome-wide values calculated from Bustamante et al. [34] (note that this comparison was between humans and chimpanzees). A neutrality index was calculated as (PN/PS)/(DN/DS). p-Values were calculated using a two-sided chi-squared test. Values below 0.05 were considered statistically significant. (f,g) The ORF of LARGE in humans has an unusually large number of SNPs compared with other species. (f) The numbers of synonymous and non-synonymous polymorphisms in the ORF of LARGE from human, chimpanzee, mouse and rat were retrieved from dbSNP and normalized to the total number of SNPs found in the LARGE locus from the respective species. (g) The fraction of SNPs found in the LARGE locus normalized to the total number of SNPs from the individual species.

References

    1. Haldane J. B. S. 1949. Disease and evolution. Ric. Sci. Suppl. A. 19, 68–76
    1. Allison A. C. 1954. Protection afforded by sickle-cell trait against subtertian malarial infection. BMJ 1, 290–29410.1136/bmj.1.4857.290 (doi:10.1136/bmj.1.4857.290) - DOI - DOI - PMC - PubMed
    1. Sabeti P. C., et al. 2006. Positive natural selection in the human lineage. Science 312, 1614–162010.1126/science.1124309 (doi:10.1126/science.1124309) - DOI - DOI - PubMed
    1. Sabeti P. C., et al. 2002. Detecting recent positive selection in the human genome from haplotype structure. Nature 419, 832–83710.1038/nature01140 (doi:10.1038/nature01140) - DOI - DOI - PubMed
    1. The International HapMap Consortium. 2003. The International HapMap Project. Nature 426, 789–79610.1038/nature02168 (doi:10.1038/nature02168) - DOI - DOI - PubMed

Publication types

LinkOut - more resources