. 2012 Feb 13;209(2):379-93.
doi: 10.1084/jem.20111569. Epub 2012 Feb 6.

Gene expression induced by Toll-like receptors in macrophages requires the transcription factor NFAT5

Affiliations

Gene expression induced by Toll-like receptors in macrophages requires the transcription factor NFAT5

Maria Buxadé et al. J Exp Med. .

Abstract

Toll-like receptors (TLRs) engage networks of transcriptional regulators to induce genes essential for antimicrobial immunity. We report that NFAT5, previously characterized as an osmostress responsive factor, regulates the expression of multiple TLR-induced genes in macrophages independently of osmotic stress. NFAT5 was essential for the induction of the key antimicrobial gene Nos2 (inducible nitric oxide synthase [iNOS]) in response to low and high doses of TLR agonists but is required for Tnf and Il6 mainly under mild stimulatory conditions, indicating that NFAT5 could regulate specific gene patterns depending on pathogen burden intensity. NFAT5 exhibited two modes of association with target genes, as it was constitutively bound to Tnf and other genes regardless of TLR stimulation, whereas its recruitment to Nos2 or Il6 required TLR activation. Further analysis revealed that TLR-induced recruitment of NFAT5 to Nos2 was dependent on inhibitor of κB kinase (IKK) β activity and de novo protein synthesis, and was sensitive to histone deacetylases. In vivo, NFAT5 was necessary for effective immunity against Leishmania major, a parasite whose clearance requires TLRs and iNOS expression in macrophages. These findings identify NFAT5 as a novel regulator of mammalian anti-pathogen responses.


Figures
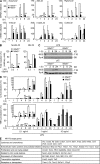
Figure 1.
Figure 1.
Induction of TLR-responsive genes in NFAT5-deficient macrophages. (A) mRNA expression for the indicated genes was measured by RT-qPCR in samples from Nfat5+/+ and Nfat5−/− BMDMs left untreated (−) or stimulated with 0.1 ng/ml LPS for 1–24 h. Graphs show the relative induction after normalization to L32 mRNA and represent the mean ± SEM of three independent experiments, with statistical significance (Student’s t test) indicated as *, P < 0.06; **, P < 0.01. (B) Induction of Nos2 and Il6 mRNA was analyzed as in A, in cells stimulated with 0.3 or 1 ng/ml LPS for 6 h. mRNA levels after normalization to L32 mRNA are shown relative to 1 ng/ml LPS–stimulated cells, which was given an arbitrary value of 100. Values represent the mean ± SEM of three independent experiments. *, P < 0.05; **, P < 0.01. (C) Western blot for iNOS in Nfat5+/+ and Nfat5−/ BMDMs left untreated (−) or stimulated with 10 µg/ml poly I:C (pIC) or 10 ng/ml LPS for 2–24 h. Pyruvate kinase (PyrK) is shown as loading control. One representative experiment is shown out of three independently performed. (D) IL-6 (top) and TNF (bottom) were measured by ELISA in cell-free supernatants from Nfat5+/+ and Nfat5−/− BMDM cultures stimulated as indicated. Values are shown relative to the cytokine production in Nfat5+/+ BMDMs after 8 h of stimulation with 10 ng/ml LPS, represented as 100%. The mean ± SEM of three independent experiments is shown (*, P < 0.06; **, P < 0.01). (E) Seven groups of selected NFAT5 target genes identified by microarray analysis of WT and NFAT5-deficient macrophages treated with 0.3 ng/ml LPS for 6 h are shown (Table S1 contains a detailed list of genes). Selected genes were induced twofold or higher by LPS in WT cells, and their induction was reduced by 50% or more in NFAT5-deficient cells. Microarray data correspond to separately hybridized samples obtained from four independent cultures of untreated or LPS-stimulated Nfat5+/+ or Nfat5−/− BMDMs.
Figure 2.
Figure 2.
Association of NFAT5 with regulatory regions of TLR-responsive genes. (A) Association of NFAT5 with the promoters of Nos2, Il6, and Ptgs2, and the enhancer region of Il12b. Formaldehyde–cross-linked chromatin from Nfat5+/+ or Nfat5−/− BMDMs left untreated (−) or stimulated with 1 ng/ml LPS for 2 h (or 1 h for Ptgs2) was immunoprecipitated with preimmune rabbit serum (pi) or a mixture of two rabbit polyclonal antibodies specific for NFAT5 (N5). Immunoprecipitated chromatin was analyzed by RT-qPCR and normalized to its respective total chromatin (input). Graphics represent the relative enrichment in chromatin immunoprecipitated by the NFAT5-specific antibodies compared with the input signal. A negative control showing the lack of binding of NFAT5 to exon 14 of the Nfat5 gene, which contains no NFAT5 binding sites, is shown. Values shown are the mean ± SEM from at least three independent experiments (*, P < 0.05; **, P < 0.01). (B) Binding of NFAT5 to the promoters of Tnf, Il1a, Traf1, Ccl2, and Ccl5 was analyzed as described in A.
Figure 3.
Figure 3.
NFAT5-dependent activation of the Nos2 promoter and iNOS induction. Activity of the hypertonicity-responsive ORE-Luc reporter (A) and the LPS-responsive mouse Nos2 promoter (iNOS-Luc; B) in RAW 264.7 cells cotransfected with a short hairpin RNA (shRNA) vector specific for GFP or two independent NFAT5-specific shRNA vectors (N5-1 and N5-2), together with the control reporter plasmid TK-Renilla. Luciferase was measured 20 h after hypertonicity treatment (500 mOsm/kg) or LPS stimulation (25 µg/ml), normalized to TK-Renilla, and represented as percentage of reporter activity with respect to cells transfected with shGFP and stimulated (100%). Graphs show the mean ± SEM of four independent experiments. Bottom panels show the Western blot for NFAT5 done in parallel to the reporter assays. Pyruvate kinase (PyrK) is shown as loading control. Results are representative of three independent experiments. (C) Activity of WT mouse Nos2 promoter construct (WT) or an NFAT5-binding site mutant (NFAT5 mut) in RAW 264.7 cells after 20 h of LPS stimulation. Luciferase activity normalized to TK-Renilla is represented as fold induction relative to the reporter activity in unstimulated cells. Graphs show the mean ± SEM of three independent experiments. (D) Activation of the Nos2 promoter in response to different TLR agonists was measured in RAW 264.7 cells cotransfected with the iNOS-Luc and TK-Renilla reporters plus either shGFP or shN5-1 vectors. Transfected cells were stimulated for 20 h with 1 µg/ml Pam3CSK4 (P3C), 300 µg/ml zymosan A (Zym), 100 µg/ml poly I:C (pIC), 25 µg/ml LPS, 1 mM loxoribine (Lox), or 1 µM CpG oligodeoxynucleotide (CpG). Luciferase activity normalized to TK-Renilla is represented as fold induction over the reporter activity in unstimulated cells (−). Graphics show the mean ± SEM of three independent experiments. (E) RAW 264.7 cells transfected with either shGFP or shN5-1 vectors were left untreated or stimulated with different TLR ligands as in D. Expression of NFAT5, iNOS, and pyruvate kinase (normalization control) was detected by Western blotting. The experiment shown is representative of three independently performed. (F) Nitric oxide production upon 24 h of stimulation with 100 µg/ml pIC or 25 µg/ml LPS in RAW 264.7 cells transfected with either shGFP or shN5-1 vectors. Graphics show the mean ± SEM of three independent experiments.
Figure 4.
Figure 4.
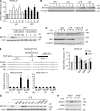
Involvement of the IKKβ–NF-κB pathway on the expression of NFAT5 in response to TLRs. (A) Quantification of NFAT5 mRNA upon stimulation of BMDMs with 10 µg/ml pIC or 10 ng/ml LPS for the indicated times. mRNA content was measured by RT-qPCR, normalized to L32 mRNA, and is shown relative to unstimulated cells, which was given an arbitrary value of 1. (B) Expression of NFAT5 in BMDMs stimulated with 1 µg/ml pIC or 1 ng/ml LPS for the indicated times was analyzed by Western blot. α-Tubulin is shown as loading control. (C) Western blot for NFAT5 in BMDMs left untreated (−), or stimulated with 10 ng/ml LPS (20 h) after 1 h of pretreatment with actinomycin d (ActD) or α-amanitin (α-Ama) at the indicated concentrations. Pyruvate kinase (PyrK) is shown as loading control. (D) Western blot for NFAT5 in BMDMs treated with 0.5 µg/ml CHX, 1 ng/ml LPS, or both during different times (CHX was added 30 min before LPS). To ensure the complete extraction of NFAT5 from cells we used urea-based whole-cell lysates. IκBα is shown as a de novo synthesis-dependent TLR-induced protein. α-Tubulin was used as loading control. (E) Schematic representation of the promoter region of the Nfat5 gene. Consensus binding sites for NF-κB (capital letters) and flanking sequences are shown for human, dog, mouse, and pig genomes. CpG-rich designate a CpG island, and the small bar under the NF-κB binding sites in the diagram shows the region amplified by the primers used in the ChIP experiments. The bottom panels show the ChIP analysis of NF-κB (p65) binding to the Nfat5 promoter or an irrelevant region (exon 14 of the Nfat5 gene) in BMDMs left untreated (−) or stimulated with 10 ng/ml LPS for 2 or 4 h. A control rabbit IgG (Ig) was included as negative control. Immunoprecipitated chromatin was analyzed by RT-qPCR and normalized to its respective total chromatin (input). Graphics represent the enrichment in chromatin immunoprecipitated by the NF-κB–specific antibody relative to the immunoprecipitation with the control IgG in unstimulated cells (which was given an arbitrary value of 1). (F) NFAT5 mRNA levels in BMDMs stimulated during 2 h with 10 µg/ml pIC or 10 ng/ml LPS without or with a 1-h pretreatment with 10 µM BAY 11–7082, 2 µM BMS-345541, or 0.1 µg/ml actinomycin d (ActD). (G) Western blot for NFAT5 in BMDMs left untreated (−), or stimulated with 10 ng/ml LPS for 20 h without inhibitors or with a 1-h pretreatment with 10 µM BAY 11–7082, 2 µM BMS-345541, 10 µM SB202190, 10 µM PD098059, 10 µM SP600125, 1 µM dexamethasone, 20 µM LY294002, or 200 nM rapamycin. DMSO and ethanol (EtOH) are vehicle controls. (H) Western blot for NFAT5 in WT (IKKβ+/+) and IKKβ-deficient (IKKβ−/) BMDMs left untreated (−) or stimulated with 10 ng/ml LPS for 15 h. Graphics in A, E, and F correspond to the mean ± SEM of three independent experiments (*, P < 0.05; **, P < 0.01). Results in B, C, D, G, and H are representative of three independent experiments.
Figure 5.
Figure 5.
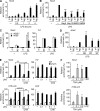
Effect of TLR-activated signaling pathways, protein synthesis, and HDAC inhibition on the recruitment of NFAT5 to target genes. (A) Time course of NFAT5 recruitment to the Nos2 promoter in BMDMs stimulated with 10 ng/ml LPS was analyzed by ChIP. Chromatin in each sample was immunoprecipitated with preimmune rabbit serum (pi) or NFAT5-specific antibodies (N5) and is represented as relative enrichment after normalization to its respective total chromatin (input). The anti-NFAT5–immunoprecipitated chromatin in unstimulated cells was used as reference sample and given an arbitrary value of 1. (B) BMDMs left untreated (−) or pretreated (1 h) with BAY 11–7082 (5 and 10 µM) or BMS-345541 (2 and 6 µM) were stimulated with 10 ng/ml LPS for 2 h and analyzed by ChIP. The anti-NFAT5–immunoprecipitated chromatin in LPS-stimulated cells was used as reference sample and given an arbitrary value of 100%. (C) The association of NFAT5 with the Nos2 and Tnf promoters in IKKβ+/+ and IKKβ−/− BMDMs after stimulation with 10 ng/ml LPS for 1 h was analyzed by ChIP. (D) BMDMs left untreated (−) or pretreated (1 h) with 10 µM SB202190, 10 µM PD098059, and 10 µM SP600125 were stimulated with 10 ng/ml LPS during 4 h and subjected to ChIP to analyze the recruitment of NFAT5 to the Nos2 promoter. (E) The association of NFAT5 with the promoter regions of Nos2, Tnf, Ccl2, and the enhancer region of Il12b, was analyzed in WT BMDMs left untreated (−) or stimulated for 2 h with 0.1 ng/ml or 1 ng/ml LPS in the presence or absence of 10 µg/ml CHX. Immunoprecipitated chromatin in each sample was normalized to its respective total chromatin (input). The anti-NFAT5–immunoprecipitated chromatin in cells stimulated with 1 ng/ml LPS was used as reference sample and given an arbitrary value of 100%. (F) As in E, but cells were left untreated or treated as indicated with TSA for 5 h, or stimulated with 10 ng/ml LPS for 2 h. The enrichment in chromatin immunoprecipitated by the NFAT5-specific antibodies is represented relative to the amount immunoprecipitated by the NFAT5 antibodies upon LPS stimulation (which was given an arbitrary value of 100). Graphics show the mean ± SEM of three (A, B, C, E, and F) or four (D) independent experiments (*, P < 0.05; **, P < 0.01).
Figure 6.
Figure 6.
In vivo response of NFAT5-deficient mice to L. major infection. (A) Intracellular iNOS expression in macrophages from the footpads of WT (left) and NFAT5-deficient (right) mice after infection with L. major. Mice were injected with PBS (filled histogram) or inoculated with 5 × 10⁵ L. major parasites (thick line histogram) in the footpad. After 24 h, cell suspensions from the skin were stained with antibodies to F4/80 and iNOS, and analyzed by flow cytometry. The dotted line represents the staining with an isotype control antibody. A representative experiment of a total of eight performed (each footpad from four mice of each group, WT and KO) is shown. (B) As in A, but the median intensity of fluorescence (MFI) of intracellular iNOS staining in F4/80+ macrophages is represented at the indicated time points. The mean ± SEM of four mice per group is shown. For the 0-h time point, the MFI values for intracellular iNOS correspond to PBS injection. (C and D) Parasite load was determined in the locally infected skin and draining lymph node (dLN), 72 h after high-dose infection in the footpad (C) or 3 wk after low-dose infection in the ear (D). The parasite burden for each individual mouse is depicted in logarithmic scale (Log10). The horizontal bars represent the mean values for each group: (C) footpads (Nfat5+/+ n = 12 and Nfat5−/− n = 16) and popliteal dLN (Nfat5+/+ n = 6 and Nfat5−/− n = 8); (D) ears (Nfat5+/+ n = 30 and Nfat5−/− n = 20) and retromaxillar dLN (Nfat5+/+ n = 15 and Nfat5−/− n = 10). (E) Analysis of parasite dissemination after L. major infection. The graph represents the quantification of the parasite load in the spleen of Nfat5+/+ (n = 15) and Nfat5−/− (n = 10) infected mice 3 wk after a low-dose inoculation. The horizontal bars represent the mean values for each group in logarithmic scale (Log10). All but one WT animal had parasite burdens below the detection limit of the technique (2.2 parasites/ organ). For C, D, and E: three series of independent infections were performed. *, P = 0.01; ***, P < 0.0001, Student’s t test of WT compared with NFAT5-deficient mice.

References

    1. Angulo I., de las Heras F.G., García-Bustos J.F., Gargallo D., Muñoz-Fernández M.A., Fresno M. 2000. Nitric oxide-producing CD11b(+)Ly-6G(Gr-1)(+)CD31(ER-MP12)(+) cells in the spleen of cyclophosphamide-treated mice: implications for T-cell responses in immunosuppressed mice. Blood. 95:212–220 - PubMed
    1. Aramburu J., Drews-Elger K., Estrada-Gelonch A., Minguillón J., Morancho B., Santiago V., López-Rodríguez C. 2006. Regulation of the hypertonic stress response and other cellular functions by the Rel-like transcription factor NFAT5. Biochem. Pharmacol. 72:1597–1604 10.1016/j.bcp.2006.07.002 - DOI - PubMed
    1. Benjamini Y., Hochberg Y. 1995. Controlling the false discovery rate: A practical and powerful approach to multiple testing. J.R. Stat. Soc. Series B Stat. Methodol. 57:289–300
    1. Berga-Bolaños R., Drews-Elger K., Aramburu J., López-Rodríguez C. 2010. NFAT5 regulates T lymphocyte homeostasis and CD24-dependent T cell expansion under pathologic hypernatremia. J. Immunol. 185:6624–6635 10.4049/jimmunol.1001232 - DOI - PubMed
    1. Bogdan C., Röllinghoff M., Diefenbach A. 2000. The role of nitric oxide in innate immunity. Immunol. Rev. 173:17–26 10.1034/j.1600-065X.2000.917307.x - DOI - PubMed

Publication types

MeSH terms