Comparative Study
. 2012 Feb 13;209(2):335-52.
doi: 10.1084/jem.20111485. Epub 2012 Feb 6.

Self-reactive human CD4 T cell clones form unusual immunological synapses

Affiliations
Comparative Study

Self-reactive human CD4 T cell clones form unusual immunological synapses

David A Schubert et al. J Exp Med. .

Abstract

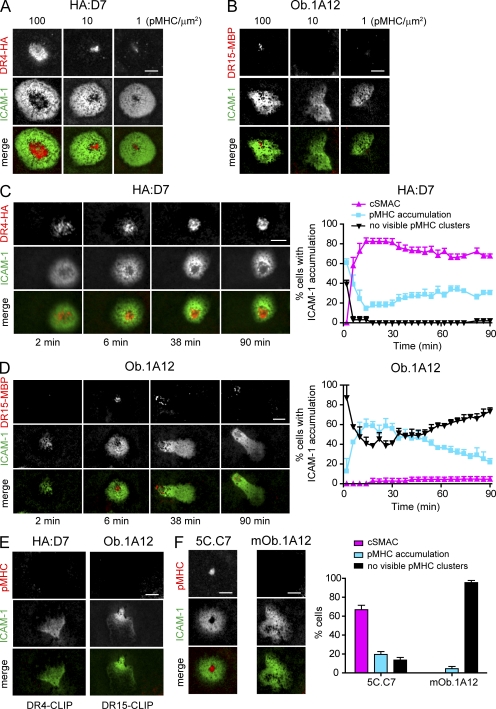
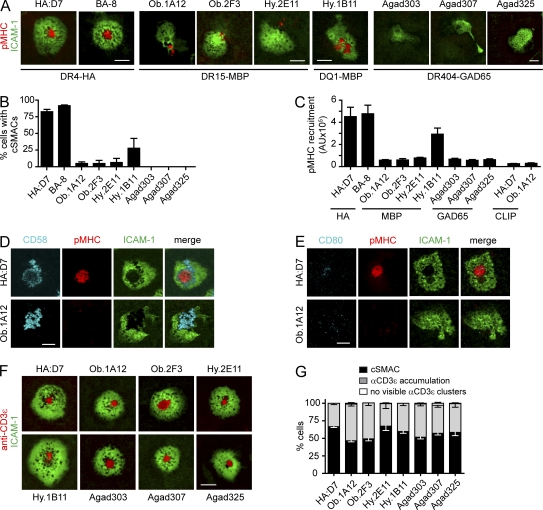
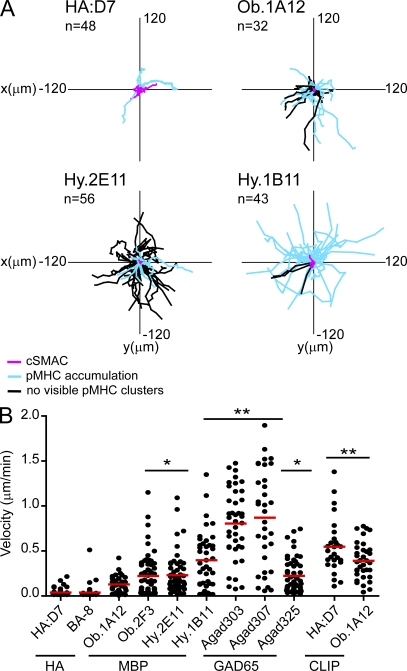
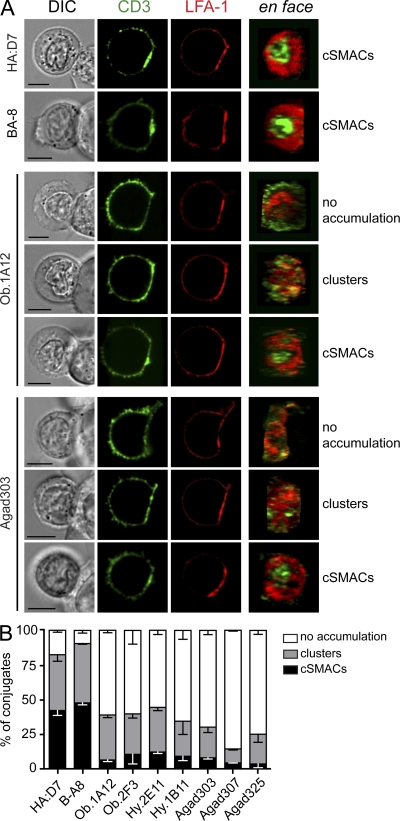
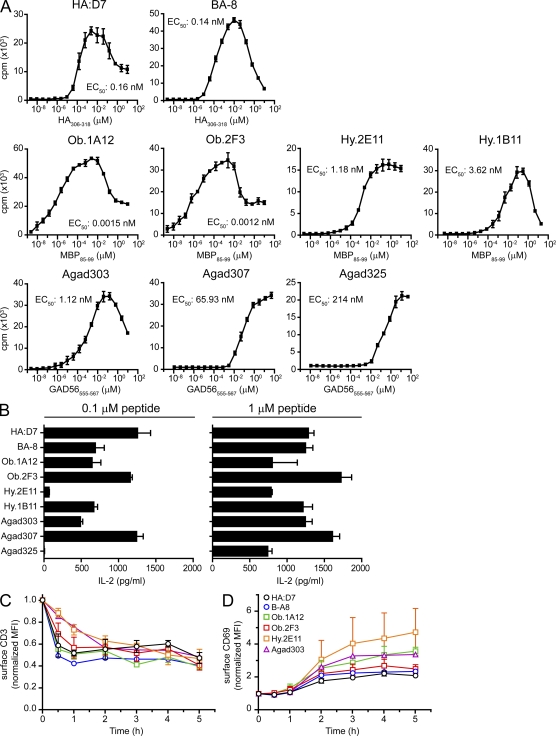
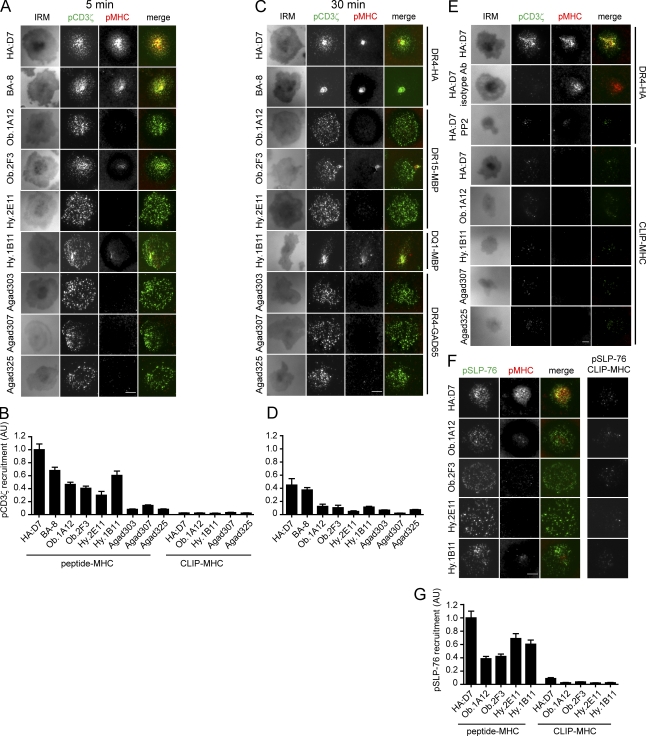
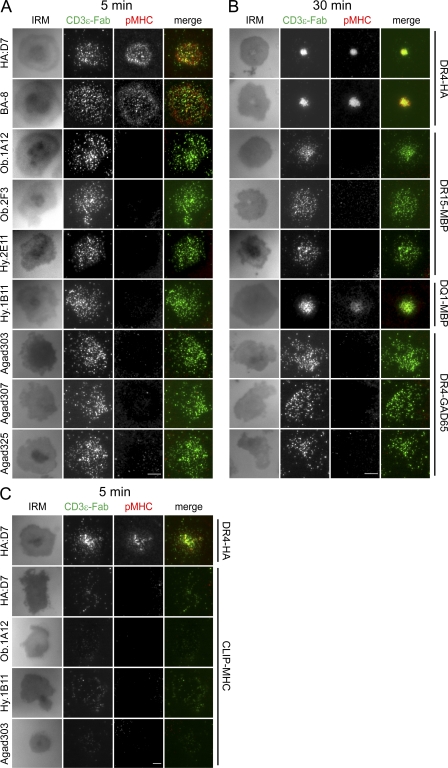
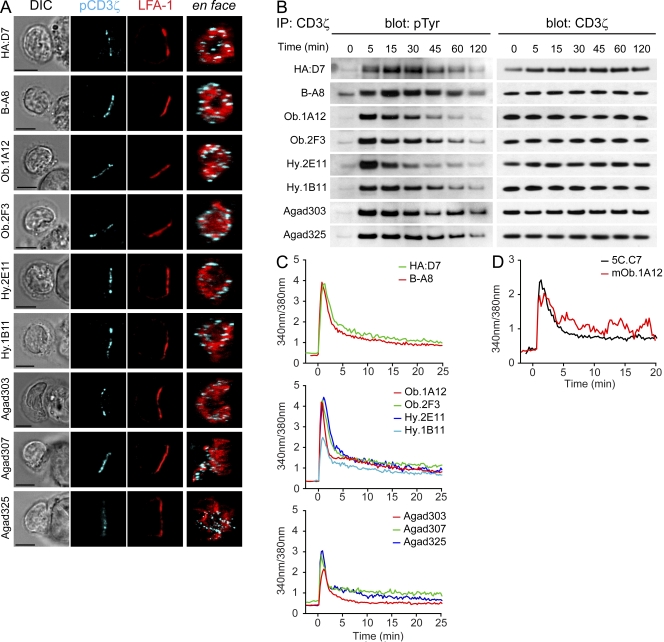
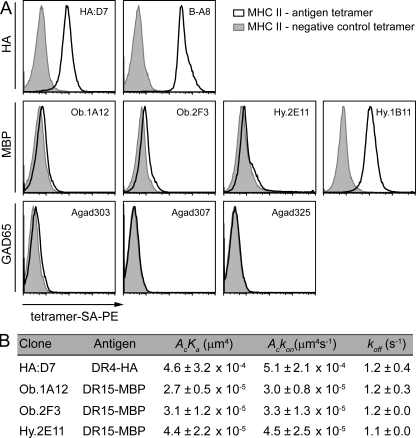
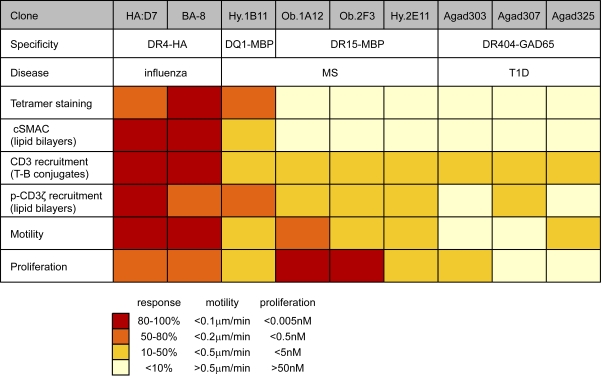
Recognition of self-peptide-MHC (pMHC) complexes by CD4 T cells plays an important role in the pathogenesis of many autoimmune diseases. We analyzed formation of immunological synapses (IS) in self-reactive T cell clones from patients with multiple sclerosis and type 1 diabetes. All self-reactive T cells contained a large number of phosphorylated T cell receptor (TCR) microclusters, indicative of active TCR signaling. However, they showed little or no visible pMHC accumulation or transport of TCR-pMHC complexes into a central supramolecular activation cluster (cSMAC). In contrast, influenza-specific T cells accumulated large quantities of pMHC complexes in microclusters and a cSMAC, even when presented with 100-fold lower pMHC densities. The self-reactive T cells also maintained a high degree of motility, again in sharp contrast to virus-specific T cells. 2D affinity measurements of three of these self-reactive T cell clones demonstrated a normal off-rate but a slow on-rate of TCR binding to pMHC. These unusual IS features may facilitate escape from negative selection by self-reactive T cells encountering very small amounts of self-antigen in the thymus. However, these same features may enable acquisition of effector functions by self-reactive T cells encountering large amounts of self-antigen in the target organ of the autoimmune disease.


Figures

Figure 1.
Figure 1.
Altered synapse formation of self-reactive Ob.1A12 T cells on planar lipid bilayers displaying pMHC and ICAM-1. (A and B) Titration of pMHC complexes. HA:D7 and Ob.1A12 T cells were incubated on glass-supported planar lipid bilayers displaying ICAM-1 (∼200 molec/µm2) and pMHC (DR4-HA or DR15-MBP) at ∼1, 10, and 100 molec/µm2. Representative images at 30 min are shown. (C and D) Kinetics of IS formation by HA:D7 and Ob.1A12 T cells incubated on planar lipid bilayers containing pMHC (∼100 molec/µm2) and ICAM-1. Each cell with ICAM-1 accumulation was categorized as showing cSMAC formation, pMHC accumulation without cSMAC formation, or no visible pMHC clusters. Graphs show mean percentage ± SEM for three to four fields with 48–65 individual cells analyzed. (E) Specificity of pMHC accumulation. HA:D7 or Ob.1A12 T cells were incubated on lipid bilayers displaying control pMHC (DR4-CLIP or DR15-CLIP at ∼100 molec/µm2) and ICAM-1. CLIP (class II–associated invariant chain peptide) was used as a control peptide. Images of ICAM-1 and pMHC at 30 min are shown. (F) Mouse 5C.C7 and mOb.1A12 T cell blasts were incubated on lipid bilayers displaying pMHC (∼100 molec/µm2) and ICAM-1. Representative images at 30 min are shown. T cells with ICAM-1 accumulation were categorized as in C and D. Bar graph shows mean percentage ± SEM for 7–11 fields with 130–161 individual cells analyzed. Data are representative of at least two experiments. Bars, 5 µm.
Figure 2.
Figure 2.
Impaired cSMAC formation and pMHC recruitment by self-reactive T cells on planar lipid bilayers. (A) Representative images for HA-specific clones (HA:D7 and BA-8), MBP-specific clones (Ob.1A12, Ob.2F3, Hy.2E11, and Hy.1B11), and GAD65-specific clones (Agad303, Agad307, and Agad325) on lipid bilayers displaying ICAM-1 and pMHC. Images were selected from a 20–90-min time period. (B) Quantification of cSMAC formation. The percentage of cells with ICAM-1 accumulation that formed a cSMAC was determined. Mean of at least three different fields ± SEM over 90 min is shown. (C) Accumulation of pMHC at the interface. Integrated fluorescence of pMHC accumulation (in arbitrary units [AU]) was determined at 30 min for all cells that accumulated ICAM-1. Shown is the mean of 17–55 individual cells for each T cell clone ± SEM. (D and E) Representative images of Ob.1A12 or HA:D7 T cells incubated on lipid bilayers displaying ICAM-1, pMHC, and CD58 or CD80 (∼100 molec/µm2) at 30 min. (F and G) Representative images of T cells on lipid bilayers displaying anti-CD3ε Fab fragment (∼150 molec/µm2) and ICAM-1. T cells that accumulated ICAM-1 were categorized as follows: cSMAC formation, anti-CD3ε accumulation, or no visible anti-CD3ε clusters. Bar graph shows mean percentage ± SEM for 4–13 fields with 80–319 individual cells analyzed. Data are representative of at least two experiments. Bars, 5 µm.
Figure 3.
Figure 3.
Continued motility of self-reactive T cells on planar lipid bilayers displaying pMHC and ICAM-1. Self-reactive and influenza-specific T cells were tracked for 90 min or for as long as they were present in the imaged field. (A) Tracks of T cell paths are shown. (B) Mean velocity of individual cells was quantified. Mean motility (indicated as red bars in B) of HA-specific T cell clones was compared with self-reactive T cell clones on lipid bilayers displaying appropriate pMHC, or HA:D7 and Ob.1A12 T cells incubated on lipid bilayers displaying control CLIP-MHC. Statistical analysis was performed using a one-way analysis of variance with Tukey’s post test with * indicating P < 0.05 and ** indicating P < 0.001. For each T cell clone, 27–60 individual cells were analyzed. Each dot in the graph represents a single cell. Data are representative of at least two independent experiments.
Figure 4.
Figure 4.
Impaired recruitment of TCR-CD3 complexes to synapses formed by self-reactive T cells and APC. (A) T cells were incubated for 30 min with peptide-pulsed EBV-transformed B cells and then fixed and stained for CD3 and LFA-1. Images on the right show an en face view of the contact area. Images for cells from HA:D7, BA-8, Ob.1A12, and Agad303 clones are shown to illustrate the different categories used for classification in B. Bars, 5 µm. (B) Analysis of TCR-CD3 accumulation at the IS in self-reactive and HA-specific T cell clones. For each clone, 100–200 T cell–B cell conjugates were classified as cSMACs, TCR-CD3 clusters (not forming a mature cSMAC), or no TCR-CD3 accumulation. Bar graphs are shown with ± SEM for two to three independent experiments.
Figure 5.
Figure 5.
Self-reactive T cells respond to low peptide concentrations. (A) Proliferation of self-reactive and influenza-specific (HA:D7, BA-8) T cell clones. B cells were co-cultured with T cells for 72 h and peptides were added in serial dilutions in triplicates. Proliferation was measured by [3H]-thymidine incorporation. Graphs show the mean ± SD. Data are representative of at least two independent experiments. The peptide concentration required for half-maximal proliferation (EC50) is indicated for each clone. (B) IL-2 secretion by self-reactive and influenza-specific T cells. T cells and B cells were co-cultured in the presence of 0.1 or 1 µM peptide. After 24 h, supernatants were subjected to IL-2 quantification. Graphs show the mean ± SD of triplicate measurements. Data are representative of at least two independent experiments. (C and D) TCR down-regulation and CD69 up-regulation on the cell surface. T cells were stimulated with peptide-pulsed B cells; at the indicated time points cells were stained with anti-CD3 and anti-CD69 antibodies and analyzed by FACS. MFI values were normalized to the MFI before stimulation. Graphs show the mean ± SD of at least two independent experiments.
Figure 6.
Figure 6.
Self-reactive T cells accumulate phosphorylated TCR and SLP-76 into contact areas with the lipid bilayer despite little or no visible pMHC accumulation. T cells were incubated on lipid bilayers with ICAM-1 and pMHC. Cells were fixed after 5 or 30 min and stained for pCD3ζ or pSLP-76. TIRF microscopy (TIRFM) was used to visualize pCD3ζ or pSLP-76. (A–D) pCD3ζ staining, pMHC fluorescence, and images for IRM are shown at 5 min (A) or 30 min (C). pCD3ζ fluorescence at cell contact areas (defined by IRM images) at 5 min (B) or 30 min (D) was quantified and normalized to the value of HA:D7 fluorescence at 5 min. For each clone, 51–127 individual cells were analyzed. (E) Specificity of microcluster detection. Controls included: staining with isotype control antibody, treatment with Src kinase inhibitor PP2, and stimulation with irrelevant CLIP-MHC. Representative images at 5 min are shown. (F and G) pSLP-76 staining and pMHC accumulation at 5 min after stimulation with pMHC or CLIP-MHC. pSLP-76 fluorescence was quantified (G), as described in B. Data are representative of at least two independent experiments. Error bars in B, D and G represent the standard error of mean. Bars, 5 µm.
Figure 7.
Figure 7.
Detection of early TCR microcluster formation by self-reactive T cells with an anti-CD3 Fab fragment. (A and B) T cells were stained with a fluorescently labeled Fab fragment specific for CD3ε and then applied to lipid bilayers containing ICAM-1 and pMHC. Cells were fixed after 5 min (A) or 30 min (B) and IRM and fluorescence images for pMHC and CD3ε were taken using TIRF microscopy. (C) Specificity of CD3ε microcluster detection by stimulation with irrelevant CLIP-MHC. Representative images at 5 min are shown. Data are representative of at least two independent experiments. Bars, 5 µm.
Figure 8.
Figure 8.
Early signaling events in self-reactive T cells with altered synapse formation. (A) Detection of microclusters of pCD3ζ in T cells conjugated for 15 min with peptide-pulsed B cells. Images on the right show an en face view of the contact area. Bars, 5 µm. (B) Kinetics of CD3ζ phosphorylation upon antigen stimulation. T cells were stimulated with peptide-pulsed B cells; after stimulation, CD3ζ was immunoprecipitated. Blots were probed for phosphorylated tyrosine (pTyr) and total CD3ζ (loading control). (C) Calcium flux. Fura-2–labeled T cells were stimulated with peptide-loaded B cells. The profiles represent a mean of 20–45 individual cells, with time 0 being the initial contact of the T cell with the B cell. See Videos 4–7 for examples. (D) Calcium mobilization in mouse 5C.C7 and mOb.1A12 TCR transgenic T cell blasts on lipid bilayers displaying ICAM-1 and pMHC. The profiles represent a mean of 33 individual cells, with time 0 being the initial contact with the lipid bilayer. Data are representative of at least two independent experiments.
Figure 9.
Figure 9.
The majority of self-reactive clones have a low TCR affinity for pMHC. (A). HA, MBP, or GAD65 reactive T cells were stained with control CLIP-MHC (MHCII-negative control tetramer) or the appropriate pMHC (MHCII-antigen tetramer) tetramers. (B) 2D affinities measured by the adhesion frequency micropipette assay for clones Ob.1A12, Ob.2F3, Hy.2E11, and HA:D7 (evaluated using the contact area [Ac]: AcKa, µm4). The 2D off-rate (koff, s−1) and the 2D on-rate (Ackon, µm4s−1) were also determined. Data are representative of at least two independent experiments.
Figure 10.
Figure 10.
Comparison of IS formation and signaling for a panel of seven self-reactive and two antiviral T cell clones. Parameters characterizing IS formation and signaling were compared using a color-coded grading system. Red indicates a response between 80 and 100% of the maximum response; orange, 50 and 80%; yellow, 20 and 50%; and light yellow, 0 and 10%. For motility, red represents <0.1 µm/min; orange, <0.2 µm/min; yellow, <0.5 µm/min; and light yellow, >0.5 µm/min. For proliferation, red corresponds to an EC50 <0.005 nM peptide; orange, <0.5 nM; yellow, <5 nM; and light yellow, >50 nM.

Comment in

  • Broken synapses in autoimmunity.
    Leavy O. Leavy O. Nat Rev Immunol. 2012 Feb 17;12(3):152. doi: 10.1038/nri3176. Nat Rev Immunol. 2012. PMID: 22343571 No abstract available.

References

    1. Anders A.K., Call M.J., Schulze M.S., Fowler K.D., Schubert D.A., Seth N.P., Sundberg E.J., Wucherpfennig K.W. 2011. HLA-DM captures partially empty HLA-DR molecules for catalyzed removal of peptide. Nat. Immunol. 12:54–61 10.1038/ni.1967 - DOI - PMC - PubMed
    1. Anderson A.C., Nicholson L.B., Legge K.L., Turchin V., Zaghouani H., Kuchroo V.K. 2000. High frequency of autoreactive myelin proteolipid protein-specific T cells in the periphery of naive mice: mechanisms of selection of the self-reactive repertoire. J. Exp. Med. 191:761–770 10.1084/jem.191.5.761 - DOI - PMC - PubMed
    1. Anderson M.S., Venanzi E.S., Klein L., Chen Z., Berzins S.P., Turley S.J., von Boehmer H., Bronson R., Dierich A., Benoist C., Mathis D. 2002. Projection of an immunological self shadow within the thymus by the aire protein. Science. 298:1395–1401 10.1126/science.1075958 - DOI - PubMed
    1. Barrett J.C., Clayton D.G., Concannon P., Akolkar B., Cooper J.D., Erlich H.A., Julier C., Morahan G., Nerup J., Nierras C., et al. ; Type 1 Diabetes Genetics Consortium 2009. Genome-wide association study and meta-analysis find that over 40 loci affect risk of type 1 diabetes. Nat. Genet. 41:703–707 10.1038/ng.381 - DOI - PMC - PubMed
    1. Brennan M., Davison P.F., Paulus H. 1985. Preparation of bispecific antibodies by chemical recombination of monoclonal immunoglobulin G1 fragments. Science. 229:81–83 10.1126/science.3925553 - DOI - PubMed

Publication types

Substances