. 2012 Mar;61(3):674-82.
doi: 10.2337/db11-0510. Epub 2012 Feb 7.

Reversal of type 1 diabetes in mice by brown adipose tissue transplant

Affiliations

Reversal of type 1 diabetes in mice by brown adipose tissue transplant

Subhadra C Gunawardana et al. Diabetes. 2012 Mar.

Abstract

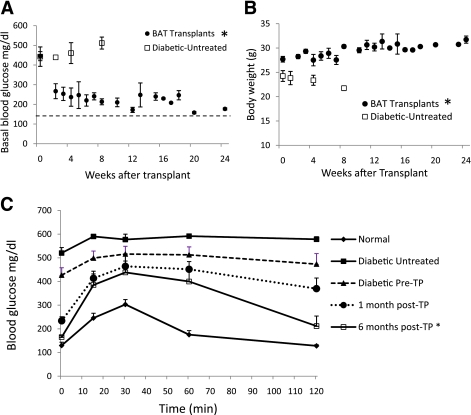
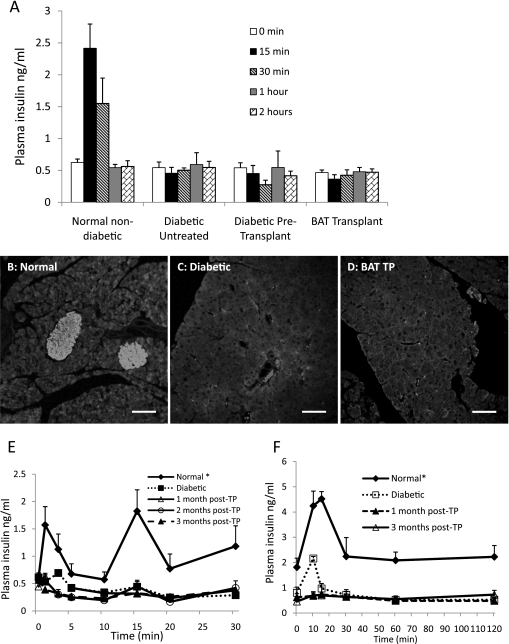
Current therapies for type 1 diabetes (T1D) involve insulin replacement or transplantation of insulin-secreting tissue, both of which suffer from numerous limitations and complications. Here, we show that subcutaneous transplants of embryonic brown adipose tissue (BAT) can correct T1D in streptozotocin-treated mice (both immune competent and immune deficient) with severely impaired glucose tolerance and significant loss of adipose tissue. BAT transplants result in euglycemia, normalized glucose tolerance, reduced tissue inflammation, and reversal of clinical diabetes markers such as polyuria, polydipsia, and polyphagia. These effects are independent of insulin but correlate with recovery of the animals' white adipose tissue. BAT transplants lead to significant increases in adiponectin and leptin, but with levels that are static and not responsive to glucose. Pharmacological blockade of the insulin receptor in BAT transplant mice leads to impaired glucose tolerance, similar to what is seen in nondiabetic animals, indicating that insulin receptor activity plays a role in the reversal of diabetes. One possible candidate for activating the insulin receptor is IGF-1, whose levels are also significantly elevated in BAT transplant mice. Thus, we propose that the combined action of multiple adipokines establishes a new equilibrium in the animal that allows for chronic glycemic control without insulin.


Figures

FIG. 1.
FIG. 1.
Subcutaneous transplantation of embryonic BAT results in improved glucose homeostasis and weight gain. Basal nonfasting blood glucose (A) and body weight (B). Horizontal dashed line in A represents baseline glucose levels in nondiabetic mice of 146.13 ± 7.36 mg/dL. A: P < 0.05, between BAT transplant and untreated diabetic controls at each time point. B: P < 0.05, at 8 weeks posttransplant. C: Glucose tolerance tests on BAT transplant, normal, and diabetic control mice. *P < 0.05, when compared with untreated diabetic controls or diabetic pretransplant condition. Normal, pretransplant, and 1 month posttransplant (n = 9); 6 months posttransplant (n = 3); untreated diabetic controls (n = 5). (A high-quality color representation of this figure is available in the online issue.)
FIG. 2.
FIG. 2.
Glucose control is independent of insulin. A: Plasma insulin response to glucose challenge in 3 months posttransplants (n = 5), diabetic pretransplants (n = 9), untreated diabetic (n = 5), and normal nondiabetic controls (n = 7). P < 0.05, at 15 and 30 min between normal control and all other groups. Insulin immunofluorescence of pancreatic sections from 3 months post–BAT transplant mice (D) compared with those of normal (B) and untreated diabetic (C) controls. Scale bar, 50 μm. E: First-phase insulin release during IPGTT 1–3 months posttransplant, compared with normal and diabetic controls (n = 3). *P < 0.05, when compared with all other groups at 1- and 3-min points. F: Arginine-stimulated insulin release 1 and 3 months posttransplant, compared with normal and diabetic controls (n = 4). *P < 0.05, when compared with all other groups at each time point.
FIG. 3.
FIG. 3.
BAT transplant failure is associated with inflammatory changes in adipose tissue. Histological sections of replenished WAT in euglycemic mouse 3 months posttransplant (C) is compared with normal (A) and diabetic (B) controls, and a transplant recipient that reverted to diabetes at 4 months (D). Sections are immunostained for TNF-α (green) and IL-6 (red). All tissues contain some green autofluorsecence, and TNF-α expression is indicated by bright green spots. TNF-α immunofluorescence appears near the right border in the normal section (A), toward the bottom in the transplant (TP) (C), and throughout the section in B and D, colocalizing with IL-6 and appearing yellow-orange. In addition to the presence of larger amounts of inflammatory markers, the failed adipose tissue shows other signs of inflammation, such as enlargement of adipocytes and infiltration of macrophages resulting in thickening of cell membranes. Sections shown are representative of four BAT transplants, two untreated diabetic controls, and two normal animals analyzed. Scale bar, 50 μm. (A high-quality digital representation of this figure is available in the online issue.)
FIG. 4.
FIG. 4.
Long-term glucose control shows a correlation with adipokines rather than insulin. Fasting blood glucose (A), glucose-stimulated insulin (B), adiponectin (C), and leptin (D) levels over time from BAT transplant mice are shown. Although insulin levels in BAT transplant mice remain consistently subnormal, adiponectin and leptin levels show fluctuations that mirror the changes in blood glucose. AC: Normal (n = 5), BAT transplant, and diabetic (n = 7). D: Normal (n = 5), BAT transplant (n = 7), and diabetic (n = 6). A: P < 0.0005, when diabetic and pretransplant (0 weeks) groups are compared with all other groups. B: P < 0.005, between normal control and all other groups. C: P < 0.001, between BAT transplants and pretransplant (0 weeks) except for 16 weeks; P < 0.001, between BAT transplants and untreated diabetic controls at 8, 12, and 24 weeks. D: P < 0.05, between BAT transplants and normal, diabetic, and pretransplant controls at 4, 8, and 20 weeks; P < 0.005, at 24 weeks posttransplant. Plasma glucagon (E) and IGF-1 (F) levels from 5- and 6-month BAT transplants compared with normal and diabetic controls. BAT transplants are associated with a decrease of glucagon and increase of IGF-1 (n = 4). E: P < 0.0005, between BAT transplants and diabetic controls; P < 0.05, between BAT transplants and normal controls. F: P < 0.05, between BAT transplants and diabetic or normal controls.
FIG. 5.
FIG. 5.
Inhibition of insulin receptor impairs glucose tolerance in euglycemic transplant mice. S981, a competitive antagonist of the insulin receptor, was administered immediately prior to glucose tolerance test. S961 resulted in impairment of glucose tolerance in both normal controls (n = 4) (A) and BAT transplant recipients euglycemic at 3 months (n = 5) (B). A: P < 0.05, when 60- and 120-min time points are compared with and without S961. B: P < 0.05, when 120-min time point is compared with and without S961.

References

    1. Casey A. Hormonal control of metabolism: regulation of plasma glucose. Surgery 2003;21:128a–128d
    1. Wozniak SE, Gee LL, Wachtel MS, Frezza EE. Adipose tissue: the new endocrine organ? A review article. Dig Dis Sci 2009;54:1847–1856 - PubMed
    1. Ahima RS. Adipose tissue as an endocrine organ. Obesity (Silver Spring) 2006;14(Suppl. 5):242S–249S - PubMed
    1. Hu X, She M, Hou H, et al. Adiponectin decreases plasma glucose and improves insulin sensitivity in diabetic Swine. Acta Biochim Biophys Sin (Shanghai) 2007;39:131–136 - PubMed
    1. Fukushima M, Hattori Y, Tsukada H, et al. Adiponectin gene therapy of streptozotocin-induced diabetic mice using hydrodynamic injection. J Gene Med 2007;9:976–985 - PubMed

Publication types