

Glycemic control and cardiovascular mortality in hemodialysis patients with diabetes: a 6-year cohort study
- PMID: 22315308
- PMCID: PMC3282812
- DOI: 10.2337/db11-1015
Glycemic control and cardiovascular mortality in hemodialysis patients with diabetes: a 6-year cohort study
Abstract
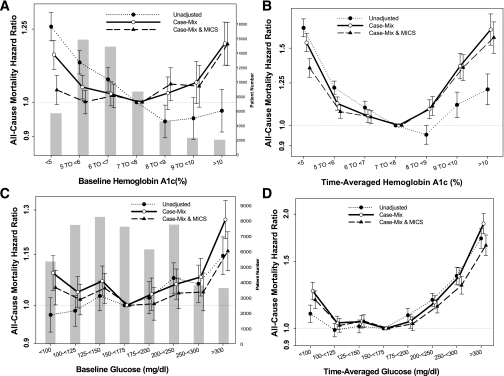
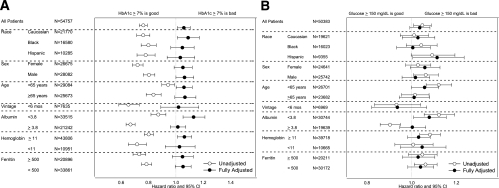
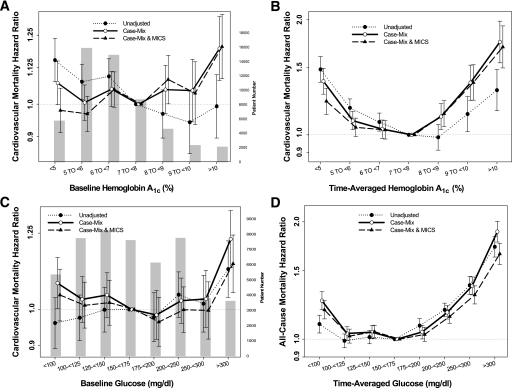
Previous observational studies using differing methodologies have yielded inconsistent results regarding the association between glycemic control and outcomes in diabetic patients receiving maintenance hemodialysis (MHD). We examined mortality predictability of A1C and random serum glucose over time in a contemporary cohort of 54,757 diabetic MHD patients (age 63 ± 13 years, 51% men, 30% African Americans, 19% Hispanics). Adjusted all-cause death hazard ratio (HR) for baseline A1C increments of 8.0-8.9, 9.0-9.9, and ≥10%, compared with 7.0-7.9% (reference), was 1.06 (95% CI 1.01-1.12), 1.05 (0.99-1.12), and 1.19 (1.12-1.28), respectively, and for time-averaged A1C was 1.11 (1.05-1.16), 1.36 (1.27-1.45), and 1.59 (1.46-1.72). A symmetric increase in mortality also occurred with time-averaged A1C levels in the low range (6.0-6.9%, HR 1.05 [95% CI 1.01-1.08]; 5.0-5.9%, 1.08 [1.04-1.11], and ≤5%, 1.35 [1.29-1.42]) compared with 7.0-7.9% in fully adjusted models. Adjusted all-cause death HR for time-averaged blood glucose 175-199, 200-249, 250-299, and ≥300 mg/dL, compared with 150-175 mg/dL (reference), was 1.03 (95% CI 0.99-1.07), 1.14 (1.10-1.19), 1.30 (1.23-1.37), and 1.66 (1.56-1.76), respectively. Hence, poor glycemic control (A1C ≥8% or serum glucose ≥200 mg/dL) appears to be associated with high all-cause and cardiovascular death in MHD patients. Very low glycemic levels are also associated with high mortality risk.
Figures
References
-
- Gaede P, Vedel P, Larsen N, Jensen GV, Parving HH, Pedersen O. Multifactorial intervention and cardiovascular disease in patients with type 2 diabetes. N Engl J Med 2003;348:383–393 - PubMed
-
- United States Renal Data System. Excerpts from the USRDS 2005 Annual Data Report: Atlas of End-Stage Renal Disease in the United States, National Institutes of Health, National Institute of Diabetes and Digestive and Kidney Diseases. Am J Kid Dis 2006;47(Suppl. 1):1–286
-
- Friedman EA. Renal syndromes in diabetes. Endocrinol Metab Clin North Am 1996;25:293–324 - PubMed
-
- Abbott KC, Bakris GL. Treatment of the diabetic patient: focus on cardiovascular and renal risk reduction. Prog Brain Res 2002;139:289–298 - PubMed
-
- Kimmel PL, Varela MP, Peterson RA, et al. Interdialytic weight gain and survival in hemodialysis patients: effects of duration of ESRD and diabetes mellitus. Kidney Int 2000;57:1141–1151 - PubMed
Publication types
MeSH terms
Substances
Grants and funding
LinkOut - more resources
Full Text Sources
Other Literature Sources
Medical
