. 2012 Apr;61(4):857-65.
doi: 10.2337/db11-1113. Epub 2012 Feb 7.

Germline TRAV5D-4 T-cell receptor sequence targets a primary insulin peptide of NOD mice

Affiliations

Germline TRAV5D-4 T-cell receptor sequence targets a primary insulin peptide of NOD mice

Maki Nakayama et al. Diabetes. 2012 Apr.

Abstract

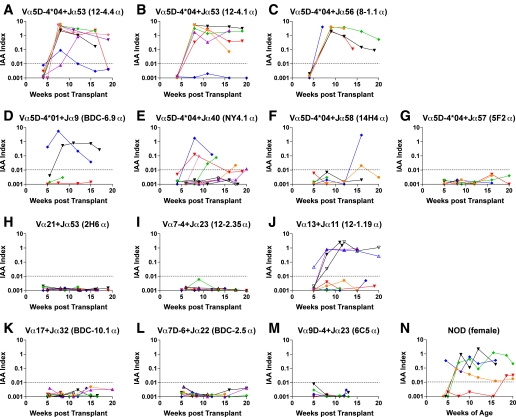
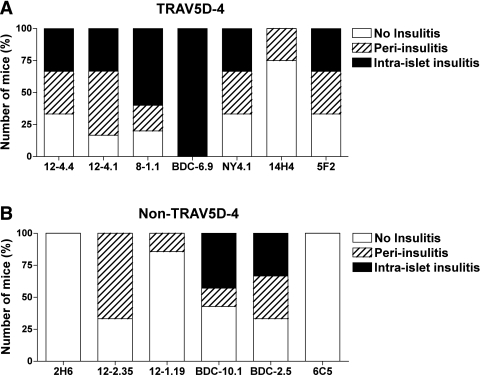
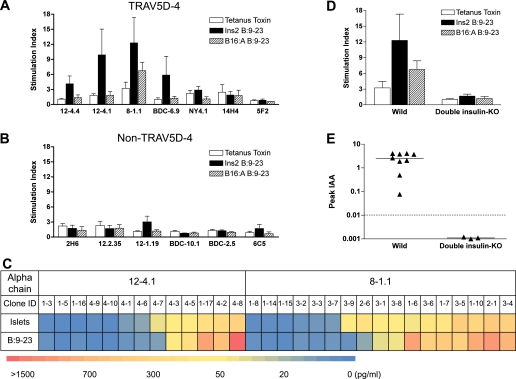
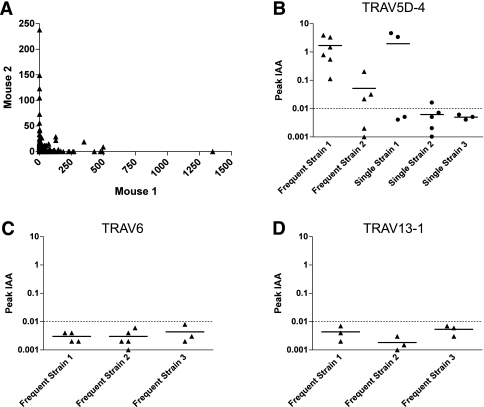
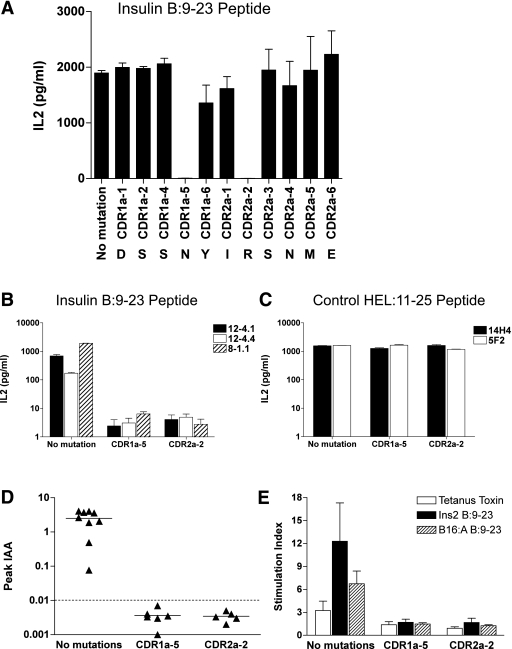
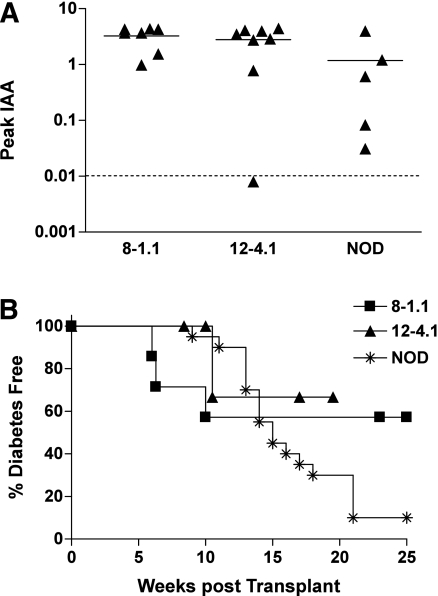
There is accumulating evidence that autoimmunity to insulin B chain peptide, amino acids 9-23 (insulin B:9-23), is central to development of autoimmune diabetes of the NOD mouse model. We hypothesized that enhanced susceptibility to autoimmune diabetes is the result of targeting of insulin by a T-cell receptor (TCR) sequence commonly encoded in the germline. In this study, we aimed to demonstrate that a particular Vα gene TRAV5D-4 with multiple junction sequences is sufficient to induce anti-islet autoimmunity by studying retrogenic mouse lines expressing α-chains with different Vα TRAV genes. Retrogenic NOD strains expressing Vα TRAV5D-4 α-chains with many different complementarity determining region (CDR) 3 sequences, even those derived from TCRs recognizing islet-irrelevant molecules, developed anti-insulin autoimmunity. Induction of insulin autoantibodies by TRAV5D-4 α-chains was abrogated by the mutation of insulin peptide B:9-23 or that of two amino acid residues in CDR1 and 2 of the TRAV5D-4. TRAV13-1, the human ortholog of murine TRAV5D-4, was also capable of inducing in vivo anti-insulin autoimmunity when combined with different murine CDR3 sequences. Targeting primary autoantigenic peptides by simple germline-encoded TCR motifs may underlie enhanced susceptibility to the development of autoimmune diabetes.


Figures

FIG. 1.
FIG. 1.
Cα knockout NOD mice retrogenic for α-chains containing TRAV5D-4 but not non–TRAV5D-4 develop anti-insulin autoimmunity. Levels of IAA in mice retrogenic for TCR α-chains with TRAV5D-4 (AG) or with non–TRAV5D-4 (HM) and in female NOD/Bdc mice (N). The α-chain sequences are derived from NOD CD4 T-cell clones (A: 12–4.4 [n = 8]; B: 12–4.1 [n = 6]; C: 8–1.1 [n = 5]; D: BDC-6.9 [n = 4]; E: NY4.1 [n = 9]; F: 14H4 [n = 5]; G: 5F2 [n = 5]; H: 2H6 [n = 7]; I: 12–2.35 [n = 7]; J: 12–1.19 [n = 8]; K: BDC-10.1 [n = 7]; L: BDC-2.5 [n = 7]; M: 6C5 [n = 4]). Symbols represent individual mice, and each panel represents a different retrogenic strain with a unique N and TRAJ region. IAA index ≥0.01 is defined as positive.
FIG. 2.
FIG. 2.
Lymphocytic infiltration in the islets of TRAV5D-4 and non–TRAV5D-4 α-chain retrogenic mice. The pancreata from TRAV5D-4 (A: 12–4.4 [n = 6]; 12–4.1 [n = 6]; 8–1.1 [n = 5]; BDC-6.9 [n = 3]; NY4.1 [n = 4]; 14H4 [n = 5]; 5F2 [n = 3]) and non–TRAV5D-4 (B: 2H6 [n = 4]; 12–2.35 [n = 3]; 12–1.19 [n = 7]; BDC-10.1 [n = 7]; BDC-2.5 [n = 6]; 6C5 [n = 3]) α-chain retrogenic mice were evaluated for the development of insulitis. The number of mice with or without peri-islet insulitis and intraislet insulitis is shown.
FIG. 3.
FIG. 3.
TRAV5D-4 α-chain retrogenic mice develop anti-insulin autoimmunity in response to the native insulin B:9–23 peptide. A, B, and D: Response to insulin B:9–23 peptides. Spleen cells from α-chain retrogenic mice (A: mice expressing an α-chain with TRAV5D-4; B: mice expressing an α-chain with non–TRAV5D-4; D: B16:A double insulin-knockout mice expressing an α-chain with 8–1.1 TRAV5D-4) were tested for response to tetanus toxin peptide 830–843 (open bar), insulin B:9–23 peptide (closed bar), and B16:A B:9–23 peptide (hatched bar) by IFN-γ ELISPOT assay. Data are mean ± SEM and cumulative from equal to or greater than three independent experiments. Stimulation Index >3 (the number of spots in cultures with peptide/without peptide) is considered positive. C: The heat map of IL-2 secretion in response to islets and the insulin B:9–23 peptide by TCR-null CD4+ 5KC cell lines expressing β-chain sequences derived from islets of TRAV5D-4 α-chain retrogenic mice along with the original α-chain. Data are mean and are cumulative from two independent experiments. E: The peak value of insulin autoantibodies of 8–1.1 TRAV5D-4 α-chain retrogenic mice with/without native insulin B:9–23 expression. Insulin autoantibodies were measured every 4 weeks between 4 and 16 weeks after bone marrow transplantation. Symbols represent individual mice (wild-type retrogenic recipient mice, n = 9; insulin B:9–23-negative (double insulin-knockout) retrogenic recipient mice, n = 3). IAA index ≥0.01 is defined as positive.
FIG. 4.
FIG. 4.
Retrogenic mice expressing α-chains detected by the 454 high-throughput sequencing. A: TRAV5D-4 α-chains infiltrating islets of two different 20-week-old NOD mice (Mouse 1 and Mouse 2) were sequenced. Individual symbols represent the number of unique CDR3 amino acid sequences that were detected in Mouse 1 (x-axis) and Mouse 2 (y-axis). B, C, and D: The peak value of insulin autoantibodies of retrogenic mice expressing α-chains that were detected by 454 sequencing (B: TRAV5D-4; C: TRAV6; D: TRAV13–1). Equal to or greater than three mice per individual strains were bled to measure insulin autoantibodies every 4 weeks between 4 and 16 weeks after bone marrow transplantation. Symbols represent individual mice. IAA index ≥0.01 is defined as positive.
FIG. 5.
FIG. 5.
Two amino acid residues at CDR1 and CDR2 of Vα TRAV5D-4 are essential for the recognition of insulin B:9–23 and anti-insulin autoimmunity induced by Vα TRAV5D-4. A: Alanine scan of the 8–1.1 insulin B:9–23-reactive TCR. 5KC cells expressing the 8–1.1 TCR with alanine mutations at individual CDRα positions were tested for the IL2 secretion in response to insulin B:9–23 peptide. Reactivity was lost only when CDR1α-5 and CDR2α-2 were mutated to alanine. Data are mean ± SEM and cumulative from two independent experiments. 5KC cells expressing TCRs (B: insulin B:9–23-reactive TCRs; C: HEL:11–25-reactive TCRs) with or without an alanine mutation at position CDR1α-5 or CDR2α-2 were tested for the IL-2 secretion in response to insulin B:9–23 (B) or HEL:11–25 (C). All three insulin B:9–23-reactive TCRs lost reactivity with these mutations, whereas anti-HEL peptide response by two HEL:11–25-reactive TCRs was unaffected. Data are mean ± SEM and cumulative from equal to or greater than three independent experiments. D: Insulin autoantibodies of mice retrogenic for 8–1.1 α-chain with or without alanine mutation at CDR1α-5 or CDR2α-2. Equal to or greater than five mice per individual strains were bled to measure insulin autoantibodies every 4 weeks between 4 and 16 weeks after bone marrow transplantation. Symbols represent individual mice. IAA index ≥0.01 is defined as positive. E: Spleen cells from mice retrogenic for 8–1.1 insulin B:9–23-reactive α-chain with or without an alanine mutation at CDR1α-5 or CDR2α-2 were tested for IFN-γ response to tetanus toxin peptide 830–843 (open bar), insulin B:9–23 peptide (closed bar), and B16:A B:9–23 peptide (hatched bar) by IFN-γ ELISPOT assay. Data are mean ± SEM and are cumulative from equal to or greater than three independent experiments. Stimulation Index >3 is considered positive.
FIG. 6.
FIG. 6.
Retrogenic mice expressing chimeric human TRAV13–1 α-chains. Development of insulin autoantibodies (A) and diabetes incidence (B) of retrogenic mice expressing chimeric 12–4.1 and 8–1.1 α-chains for which Vα sequences were replaced with human TRAV13–1. Data of female wild-type NOD/Bdc mice are included for comparison. A: Chimeric retrogenic mice expressing human TRAV13–1 α-chains developed insulin autoantibodies. Symbols represent the peak values of insulin autoantibodies of individual mice (8–1.1: n = 8; 12–4.1: n = 8; NOD/Bdc: n = 5). IAA index ≥0.01 is defined as positive. B: Chimeric retrogenic mice (8–1.1: squares [n = 4]; 12–4.1 [n = 4]: triangles) developed diabetes.

References

    1. Di Lorenzo TP, Peakman M, Roep BO. Translational mini-review series on type 1 diabetes: Systematic analysis of T cell epitopes in autoimmune diabetes. Clin Exp Immunol 2007;148:1–16 - PMC - PubMed
    1. Atkinson MA, Gianani R. The pancreas in human type 1 diabetes: providing new answers to age-old questions. Curr Opin Endocrinol Diabetes Obes 2009;16:279–285 - PubMed
    1. Santamaria P. The long and winding road to understanding and conquering type 1 diabetes. Immunity 2010;32:437–445 - PubMed
    1. Bluestone JA, Herold K, Eisenbarth G. Genetics, pathogenesis and clinical interventions in type 1 diabetes. Nature 2010;464:1293–1300 - PMC - PubMed
    1. Michels AW, Nakayama M. The anti-insulin trimolecular complex in type 1 diabetes. Curr Opin Endocrinol Diabetes Obes 2010;17:329–334 - PMC - PubMed

Publication types

MeSH terms