. 2012 Mar;33(6):724-33.
doi: 10.1093/eurheartj/ehs016. Epub 2012 Feb 6.

A novel clinical method for quantification of regional left ventricular pressure-strain loop area: a non-invasive index of myocardial work

Affiliations

A novel clinical method for quantification of regional left ventricular pressure-strain loop area: a non-invasive index of myocardial work

Kristoffer Russell et al. Eur Heart J. 2012 Mar.

Abstract

Aims: Left ventricular (LV) pressure-strain loop area reflects regional myocardial work and metabolic demand, but the clinical use of this index is limited by the need for invasive pressure. In this study, we introduce a non-invasive method to measure LV pressure-strain loop area.

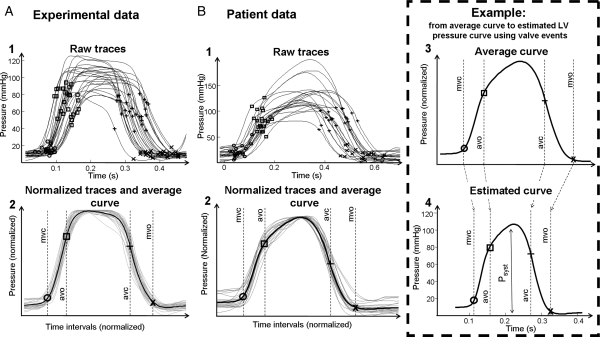
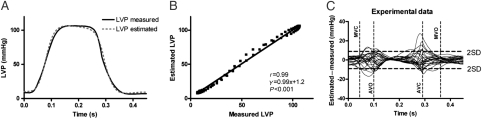
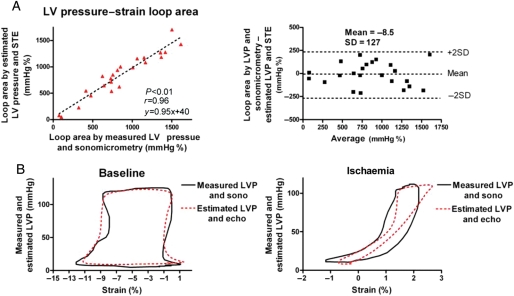
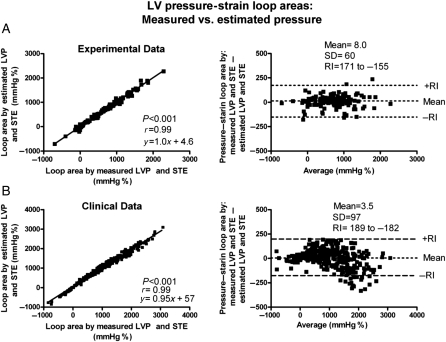
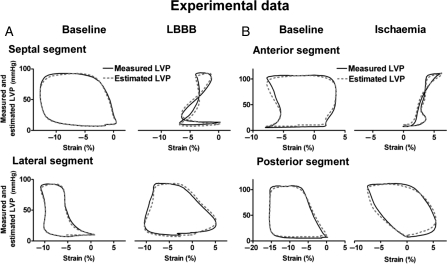
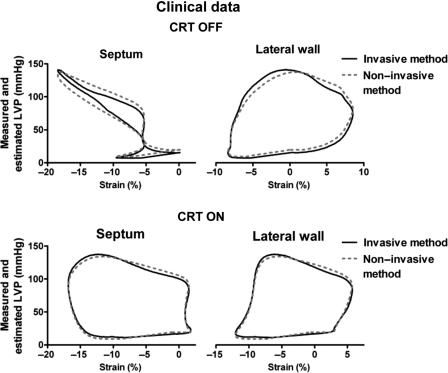
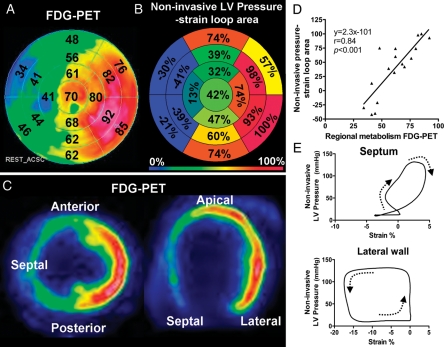
Methods and results: Left ventricular pressure was estimated by utilizing the profile of an empiric, normalized reference curve which was adjusted according to the duration of LV isovolumic and ejection phases, as defined by timing of aortic and mitral valve events by echocardiography. Absolute LV systolic pressure was set equal to arterial pressure measured invasively in dogs (n = 12) and non-invasively in patients (n = 18). In six patients, myocardial glucose metabolism was measured by positron emission tomography (PET). First, we studied anaesthetized dogs and observed an excellent correlation (r = 0.96) and a good agreement between estimated LV pressure-strain loop area and loop area by LV micromanometer and sonomicrometry. Secondly, we validated the method in patients with various cardiac disorders, including LV dyssynchrony, and confirmed an excellent correlation (r = 0.99) and a good agreement between pressure-strain loop areas using non-invasive and invasive LV pressure. Non-invasive pressure-strain loop area reflected work when incorporating changes in local LV geometry (r = 0.97) and showed a strong correlation with regional myocardial glucose metabolism by PET (r = 0.81).

Conclusions: The novel non-invasive method for regional LV pressure-strain loop area corresponded well with invasive measurements and with directly measured myocardial work and it reflected myocardial metabolism. This method for assessment of regional work may be of clinical interest for several patients groups, including LV dyssynchrony and ischaemia.


Figures

Figure 1
Figure 1
Estimation of left ventricular pressure curve. (A, 1) Raw left ventricular pressure data from dogs used for creating a profile of the reference pressure waveform, consisting of pressure recordings under different haemodynamic situations. Timing of mitral and aortic valve events is indicated. (A, 2) The raw pressure waveforms (grey curves) have been stretched or compressed along the time axis between individual valve events in order to make the valvular events coincide for all recordings. The waveforms have also been vertically scaled to have the same peak value. The averaged waveform to be used for predicting pressure traces is indicated by the black curve. (B, 1 and 2) Patient data: estimation of average pressure waveform as described in (A, 1) and (A, 2). (B, 3) The averaged waveform with arbitrary time intervals, transferred from (B, 2). (B, 4) Prediction of the left ventricular pressure waveform is based on the timing of valvular event. The left ventricular pressure waveform is constructed by adjusting the duration of time intervals to match the actual valvular timing as determined by echocardiography in the specific subject. In addition to the time-axis adjustments, the waveform has been scaled according to systolic arterial cuff pressure.
Figure 2
Figure 2
Comparison between estimated and measured left ventricular pressure. (A) Traces from a representative dog. (B) Point-for-point correlation between measured left ventricular pressure and the estimated left ventricular pressure curve for the same animal as in (A). (C) There was good agreement between measured left ventricular pressure vs. estimated left ventricular pressure as a function of time for all the animals (limits of agreement −8.9–8.9 mmHg).
Figure 3
Figure 3
(A) Correlation and agreement between area of the pressure–strain loops by estimated left ventricular pressure and speckle tracking echocardiography vs. measured left ventricular pressure and sonomicrometry. (B) Representative traces showing pressure–strain loops by left ventricular pressure and sonomicrometry (black line) vs. estimated left ventricular pressure and echocardiography (red dotted line). Measurements during baseline (left panel) and ischaemia (right panel). Sono, sonomicrometry; echo, speckle tracking echocardiography.
Figure 4
Figure 4
Correlation and agreement between area of the pressure–strain loops by estimated left ventricular pressure and speckle tracking echocardiography (STE) vs. measured left ventricular pressure and STE. (A) Experimental data. (B) Clinical data. Note that the same strain data are used for calculation by the two methods to show the isolated variation in loop area by using the non-invasive left ventricular pressure curve vs. measured left ventricular pressure. RI, reference interval.
Figure 5
Figure 5
Representative traces showing pressure–strain loops by left ventricular pressure and speckle-tracking echocardiography (solid line) vs. estimated left ventricular pressure and speckle-tracking echocardiography (dashed line). Measurements during baseline and left bundle branch block (A) and during baseline and ischaemia (B) in the experimental dog model.
Figure 6
Figure 6
Loop areas by left ventricular pressure and speckle-tracking echocardiography (solid line) vs. the non-invasive method by estimated left ventricular pressure and speckle-tracking echocardiography (dashed line), for a septal and lateral wall segment in a patient with the cardiac resynchronization therapy device turned on and off.
Figure 7
Figure 7
Data from one representative patient. (A) Bull's eye plot showing relative glucose metabolism by fluorodeoxyglucose positron emission tomography (FDG-PET) in a representative patient with left bundle branch block. The point in the left ventricular myocardium with the highest FDG uptake was used as a reference (100%), and segmental values were reported as percentages of this value. (B) Bull's eye plot with similar anatomical distribution as in (A), showing relative loop area by estimated left ventricular pressure and speckle-tracking echocardiography. The segment with the largest loop area was used as a reference (100%), and segmental values were reported as percentages of this value. (C) Correlation between regional metabolism by FDG-PET and loop area by estimated left ventricular pressure and speckle-tracking echocardiography. (D) Representative pictures showing regional distribution of glucose metabolism by FDG-PET for short-axis (left panel) and four-chamber (right panel) views. (E) Estimated left ventricular pressure and speckle-tracking echocardiography loops from the septum and lateral wall.

References

    1. Suga H. Total mechanical energy of a ventricle model and cardiac oxygen consumption. Am J Physiol. 1979;236:H498–H505. - PubMed
    1. Takaoka H, Takeuchi M, Odake M, Yokoyama M. Assessment of myocardial oxygen consumption (Vo2) and systolic pressure–volume area (PVA) in human hearts. Eur Heart J. 1992;13(Suppl. E):85–90. - PubMed
    1. Hisano R, Cooper G. Correlation of force–length area with oxygen consumption in ferret papillary muscle. Circ Res. 1987;61:318–328. - PubMed
    1. Tyberg JV, Forrester JS, Wyatt HL, Goldner SJ, Parmley WW, Swan HJ. An analysis of segmental ischemic dysfunction utilizing the pressure–length loop. Circulation. 1974;49:748–754. - PubMed
    1. Forrester JS, Tyberg JV, Wyatt HL, Goldner S, Parmely WW, Swan HJ. Pressure–length loop: a new method for simultaneous measurement of segmental and total cardiac function. J Appl Physiol. 1974;37:771–775. - PubMed

Publication types

MeSH terms