Comparative Study
. 2012 Feb 28;109(9):3516-21.
doi: 10.1073/pnas.1113148109. Epub 2012 Feb 6.

Individual variability in functional connectivity predicts performance of a perceptual task

Affiliations
Comparative Study

Individual variability in functional connectivity predicts performance of a perceptual task

Antonello Baldassarre et al. Proc Natl Acad Sci U S A. .

Erratum in

Abstract

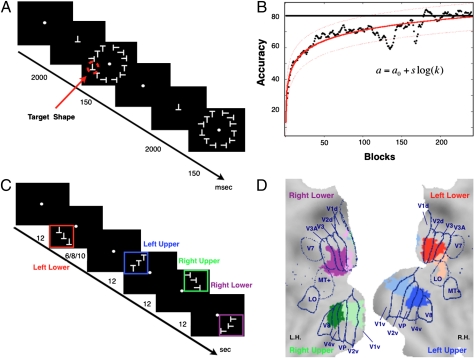
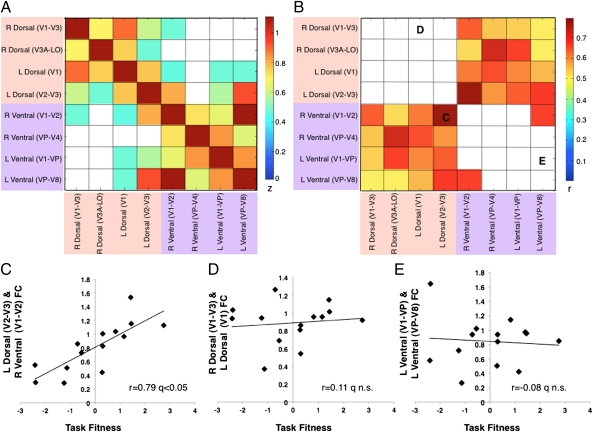
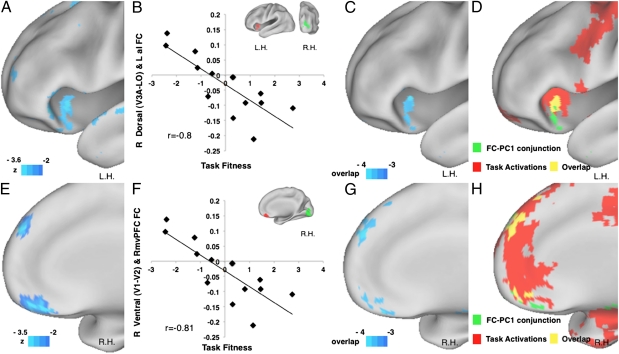
People differ in their ability to perform novel perceptual tasks, both during initial exposure and in the rate of improvement with practice. It is also known that regions of the brain recruited by particular tasks change their activity during learning. Here we investigate neural signals predictive of individual variability in performance. We used resting-state functional MRI to assess functional connectivity before training on a novel visual discrimination task. Subsequent task performance was related to functional connectivity measures within portions of visual cortex and between visual cortex and prefrontal association areas. Our results indicate that individual differences in performing novel perceptual tasks can be related to individual differences in spontaneous cortical activity.


Conflict of interest statement

The authors declare no conflict of interest.

Figures

Fig. 1.
Fig. 1.
Behavioral training, psychophysics results, visuotopic localizer, and ROIs. (A) Experimental paradigm. (B) x axis, number of blocks; y axis, accuracy (i.e., percentage of correct response corrected for percentage of false alarms). Black dots display the group average performance block by block; solid red line indicates the psychophysical fitting model a = a0 + slog(k) with prediction bounds at 95% of confidence level (dotted lines). (C) Design of visuotopic localizer. Squares of different colors (not shown in real display) indicate a visual quadrant. (D) Visual ROIs/seeds. Eight visual regions (seeds) defined on the basis of the visuotopic localizer scan are displayed on the flattened representation of posterior occipital cortex using the PALS atlas (29). Blue lines are approximate borders between retinotopic visual areas based on a standard atlas (29) L.H., left hemisphere; R.H., right hemisphere.
Fig. 2.
Fig. 2.
Task fitness and pretraining FC to/from visual cortex. (A) Voxel-wise FC–PC1 correlation map starting from a seed region in the right ventral visual seed (V1–V2; black border), corresponding to the left upper visual quadrant. The map is projected onto a flattened representation of the posterior occipital cortex using the PALS atlas (29). Color scale: yellow/orange indicates positive correlation (Z-statistic of Pearson r) thresholded at Z > 2, P < 0.05, and Monte Carlo corrected. Blue color indicates negative correlation. Blue lines are the same as in Fig. 1D. L.H., left hemisphere; R.H., right hemisphere. (B) x axis, task fitness, i.e., principal component scores of PC1; y axis, FC (Fisher Z-transformed) between a right ventral visual seed V1–V2 (green, Inset; same as in A) and a left dorsal visual region (red) extracted from the FC–PC1 correlation map in A (Talairach coordinates, −06 −96 +08; 185 voxels). Each diamond represents an observer. (C) Conjunction of eight voxel-wise FC–PC1 correlation maps, one for each visual seed shown in Fig. 1D (Table S1 provides coordinates). Color scale: yellow/orange indicates overlap of positive correlations (range, 1–8); cyan/blue indicates overlap of negative correlations. (D) Conjunction map between visuotopic localizer activations (Z statistic > 3, P < 0.05, Monte Carlo corrected; Methods; red) and FC-PC1 conjunction map thresholded four of eight (green). Overlapped voxels are in yellow.
Fig. 3.
Fig. 3.
Task fitness and pretraining FC within visual cortex. (A) Correlation matrix (Fisher Z-transformed Pearson coefficient) of all ROI pairs in visual cortex. Yellow/orange color indicates positive correlations, white color indicates nonsignificant correlations (permutation test on the entire correlation matrix; FDR q < 0.05). Dorsal visual regions are highlighted by light pink, ventral visual regions by light purple. (B) Correlation matrix (Pearson coefficient r) of PC1 and FC between all possible ROI pairs in visual cortex. Red/yellow cells indicate positive FC–PC1 correlations, white cells indicate nonsignificant correlations (permutation test on the entire correlation matrix; FDR q < 0.05). (CE) x axis, task fitness, i.e., principal component scores of PC1; y axis, FC (Fisher Z-transformed) between two heterotopic (C), homotopic (D), and neighboring (E) visual regions. Each diamond represents an observer. For Pearson correlation coefficient, permutation test was performed on the entire correlation matrix (FDR q < 0.05).
Fig. 4.
Fig. 4.
Task fitness and pretraining FC to/from visual cortex and frontal regions. (A) Lateral view of the voxel-wise FC–PC1 correlation map starting from a right dorsal visual seed (V3A–LO), corresponding to the left lower visual quadrant. Color scale is the same as in Fig. 2. L.H., left hemisphere. (B) x axis, task fitness; y axis, FC (Fisher Z-transformed) between a right dorsal visual seed V3A–LO (green, Inset; same as in A) and left anterior insula (LaI; red) extracted from the FC–PC1 correlation map in A (Talairach coordinates, −38 +18 −07; 171 voxels). Each diamond represents an observer. (C) Conjunction map of FC–PC1 correlation maps from eight visual seeds. Color scale is the same as in Fig. 2. (D) Conjunction map between activation map of orientation discrimination task (trained plus untrained shape greater than fixation, Z-statistic >3, P < 0.05, Monte Carlo corrected; Methods) and FC–PC1 conjunction map thresholded at negative three of eight (green). Overlapped voxels are in yellow. (E) Medial view of the voxel-wise FC–PC1 correlation map starting from a right ventral visual seed (V1–V2), corresponding to the left upper visual quadrant. Color scale is the same as in A. R.H., right hemisphere. (F) x axis as in B; y axis is FC (Fisher Z-transformed) between a right ventral visual seed V1–V2 (green, Inset) and a right ventral medial prefrontal cortex (RvmPFC; red) extracted from the FC–PC1 correlation map in A (Talairach coordinates, +04 +38 −18; 120 voxels). Each diamond represents an observer. (G) Medial view of the same conjunction map in B, with the same color scale. (H) Conjunction map between deactivation map of orientation discrimination task (trained plus untrained shape less than fixation, Z-statistic > 3, P < 0.05, Monte Carlo corrected; Methods) and FC–PC1 conjunction map thresholded negative three of eight (green). Overlapped voxels are in yellow.

Comment in

References

    1. Halpern SD, Andrews TJ, Purves D. Interindividual variation in human visual performance. J Cogn Neurosci. 1999;11:521–534. - PubMed
    1. Fahle M, Edelman S, Poggio T. Fast perceptual learning in hyperacuity. Vision Res. 1995;35:3003–3013. - PubMed
    1. Fahle M, Henke-Fahle S. Interobserver variance in perceptual performance and learning. Invest Ophthalmol Vis Sci. 1996;37:869–877. - PubMed
    1. Schmitt C, Kromeier M, Bach M, Kommerell G. Interindividual variability of learning in stereoacuity. Graefes Arch Clin Exp Ophthalmol. 2002;240:704–709. - PubMed
    1. Fahle M. Perceptual learning: A case for early selection. J Vis. 2004;4:879–890. - PubMed

Publication types