. 2012 Feb 8:5:8.
doi: 10.1186/1756-6606-5-8.

Dysfunction of the RAR/RXR signaling pathway in the forebrain impairs hippocampal memory and synaptic plasticity

Affiliations

Dysfunction of the RAR/RXR signaling pathway in the forebrain impairs hippocampal memory and synaptic plasticity

Masanori Nomoto et al. Mol Brain. .

Abstract

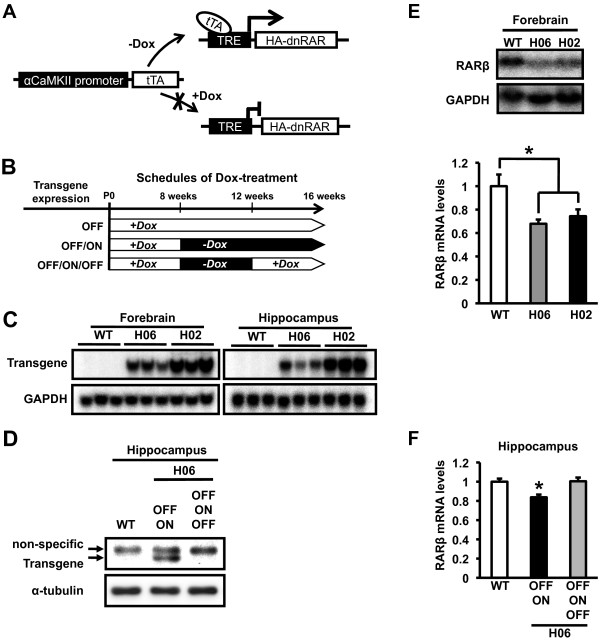
Background: Retinoid signaling pathways mediated by retinoic acid receptor (RAR)/retinoid × receptor (RXR)-mediated transcription play critical roles in hippocampal synaptic plasticity. Furthermore, recent studies have shown that treatment with retinoic acid alleviates age-related deficits in hippocampal long-term potentiation (LTP) and memory performance and, furthermore, memory deficits in a transgenic mouse model of Alzheimer's disease. However, the roles of the RAR/RXR signaling pathway in learning and memory at the behavioral level have still not been well characterized in the adult brain. We here show essential roles for RAR/RXR in hippocampus-dependent learning and memory. In the current study, we generated transgenic mice in which the expression of dominant-negative RAR (dnRAR) could be induced in the mature brain using a tetracycline-dependent transcription factor and examined the effects of RAR/RXR loss.

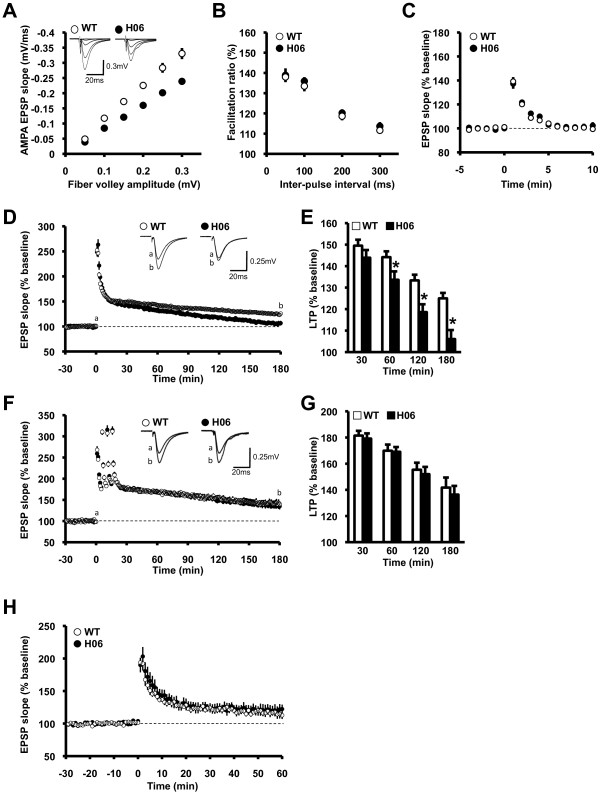
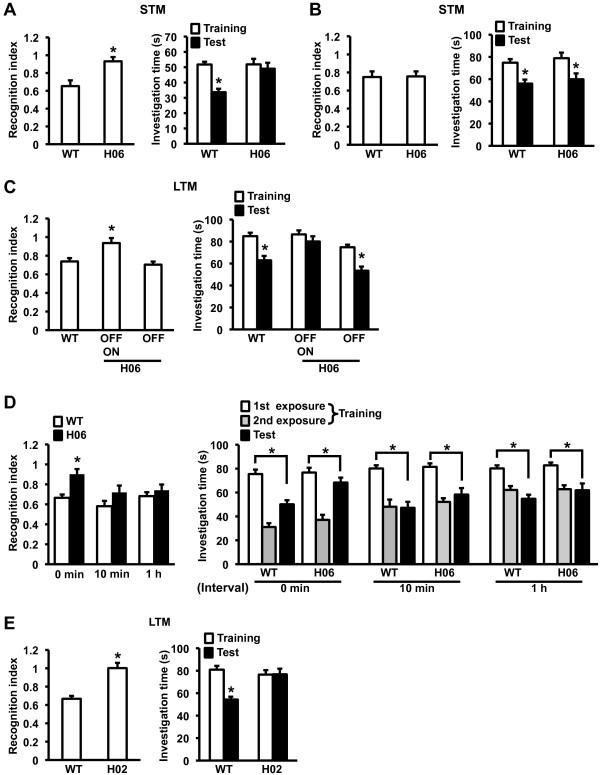
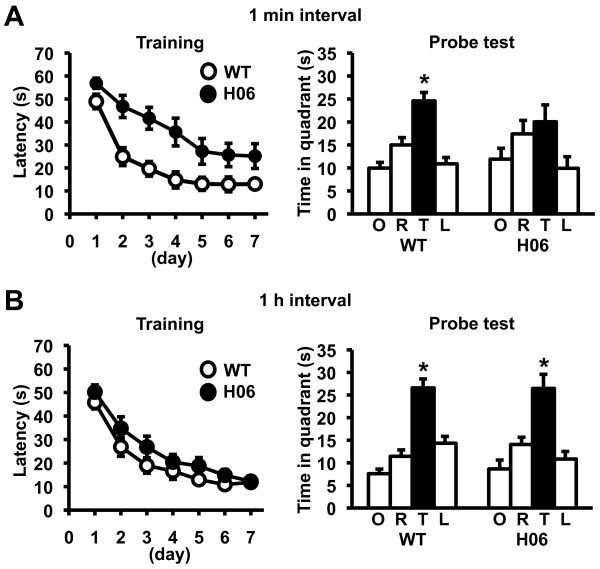
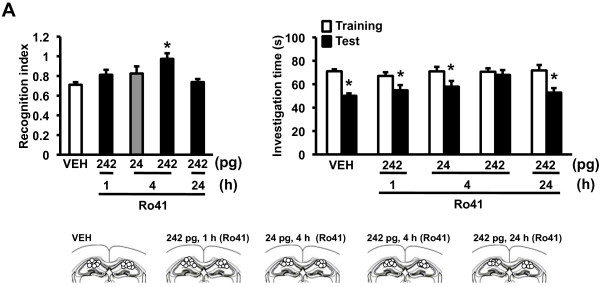
Results: The expression of dnRAR in the forebrain down-regulated the expression of RARβ, a target gene of RAR/RXR, indicating that dnRAR mice exhibit dysfunction of the RAR/RXR signaling pathway. Similar with previous findings, dnRAR mice displayed impaired LTP and AMPA-mediated synaptic transmission in the hippocampus. More importantly, these mutant mice displayed impaired hippocampus-dependent social recognition and spatial memory. However, these deficits of LTP and memory performance were rescued by stronger conditioning stimulation and spaced training, respectively. Finally, we found that pharmacological blockade of RARα in the hippocampus impairs social recognition memory.

Conclusions: From these observations, we concluded that the RAR/RXR signaling pathway greatly contributes to learning and memory, and LTP in the hippocampus in the adult brain.


Figures

Figure 1
Figure 1
dnRAR mice displayed Dox-dependent expression of dnRAR and down-regulation of RARβ expression in the forebrain. (A) Schematic representation of Dox-dependent regulation of dnRAR in the forebrain. (B) Experimental design. Schedule for the treatment of dnRAR mice with Dox. The mice were treated with Dox throughout their lifetime (OFF) or until they were 8 weeks old (OFF - transgene ON; OFF/ON). OFF/ON-dnRAR mice were treated again with Dox for 4 weeks following the withdrawal of Dox for 4 weeks (OFF/ON/OFF). (C) Northern blot analysis of dnRAR mRNA in the forebrain and hippocampus of dnRAR H06 and H02 mice and WT littermates (WT). The upper and lower panels shows the expression of dnRAR mRNA (2.8 kbp) and GAPDH mRNA (1.3 kbp) as an internal control, respectively. (D) Western blot analysis of dnRAR protein in the hippocampus of dnRAR H06 mice and WT littermates. The upper panel shows the expression of a 50-kDa protein corresponding to dnRAR. The upper arrow indicates non-specific binding and the lower arrow indicates dnRAR protein. The lower panel shows the expression of α-tubulin as an internal control. (E) Northern blot analysis of RARβ mRNA in the forebrain of dnRAR H06 and H02 mice and WT littermates. The lower panel indicates the quantification of RARβ mRNA levels in the forebrain of dnRAR H06 and H02 mice and WT littermates (WT, n = 8; H06, n = 8; H02, n = 8). The levels of RARβ mRNA were normalized according to the GAPDH signal. *p < 0.05, compared with WT littermates. (F) qRT-PCR analysis of RARβ mRNA in the hippocampus of dnRAR H06 and H02 mice and WT littermates. Quantification of RARβ mRNA levels in the hippocampus of OFF/ON-dnRAR H06 mice, OFF/ON/OFF-dnRAR H06 mice, and WT littermates (WT, n = 29; OFF/ON, n = 24; OFF/ON/OFF, n = 16). The levels of RARβ mRNA were normalized according to the levels of GAPDH mRNA. *p < 0.05, compared with the other groups. Error bars indicate SEM.
Figure 2
Figure 2
Basal synaptic transmission and LTP in the hippocampus of dnRAR mice. (A) The input-output relationships of AMPA receptor-mediated EPSP in WT (n = 9) and dnRAR H06 (n = 8) mice. The sample traces in the inset represent the responses evoked with the five different stimulus intensities and the stimulus artifacts were truncated. The data were first sorted by the amplitude range of the fiber volleys, and then the EPSP slopes were averaged within each range. (B) PPF induced by stimulating afferent fibers twice at intervals of 50, 100, 200, and 300 ms in WT (n = 9) and dnRAR H06 (n = 8) mice. (C) PTP induced by high-frequency stimulation (one 100 Hz, 1 s train) in the presence of D-APV (50 μM) in WT (139.2 ± 3.5% of baseline; n = 12) and dnRAR H06 (137.2 ± 4.1% of baseline; n = 10) mice. (D) LTP induced by single conditioning stimulation (one 100 Hz, 1 s train) in WT (n = 30) and dnRAR H06 (n = 16) mice. The initial EPSP slopes were measured, and the values were normalized in each experiment to the averaged slope value measured during the control period (-30 to 0 min). Conditioning stimulation was applied at 0 min. The sample traces in the inset represent the EPSPs (average of 10 consecutive responses) of WT and H06 mice recorded at the times indicated by the letters. The stimulus artifacts were truncated. (E) Summary of LTP induced by single conditioning stimulation in WT and dnRAR H06 mice (21-30 min: WT, 149.5 ± 2.0%; H06, 143.9 ± 3.5%; 51-60 min: WT, 144.1 ± 2.4%; H06, 133.6 ± 3.8%; 111-120 min: WT, 133.3 ± 2.9%; H06, 118.6 ± 3.6%; 171-180 min: WT, 125.0 ± 3.3%; H06, 106.0 ± 4.2% of baseline) (t test, *p < 0.05). (F) LTP induced by strong conditioning stimulation (four 100 Hz, 1 s trains at 5 min intervals) in WT (n = 6) and dnRAR H06 (n = 9) mice. The initial EPSP slopes were measured, and the values were normalized in each experiment to the averaged slope value measured during the control period (-30 to 0 min). Conditioning stimulation was applied at 0 min. The sample traces in the inset represent the EPSPs (average of 10 consecutive responses) of WT and H06 mice recorded at the times indicated by the letters. The stimulus artifacts were truncated. (G) Summary of normalized LTP induced by strong conditioning stimulation in WT and dnRAR H06 mice (21-30 min: WT, 181.4 ± 3.6%; H06, 179.2 ± 3.9%; 51-60 min: WT, 169.9 ± 4.6%; H06, 169.0 ± 3.6%; 111-120 min: WT, 155.3 ± 5.3%; H06, 151.9 ± 5.5%; 171-180 min: WT, 141.7 ± 7.7%; H06, 136.3 ± 6.6% of baseline). (H) STP induced by short conditioning stimulation (one 100 Hz, 100 ms train) in WT (116.2 ± 5.1% of baseline; n = 5) and dnRAR H06 (120.6 ± 8.1% of baseline; n = 5) mice. The initial EPSP slopes were measured, and the values were normalized in each experiment to the averaged slope value measured during the control period (-30 to 0 min). Conditioning stimulation was applied at 0 min. Error bars indicate SEM.
Figure 3
Figure 3
Impaired social recognition memory in dnRAR mice and its rescue by stronger training. (A) STM formed by training for 1.5 min (WT, n = 14; H06, n = 15). Recognition index (left panel). *p < 0.05, compared with WT. Investigation time (right panel). *p < 0.05, compared with training. (B) STM formed by training for 3 min (WT, n = 8; H06, n = 10). Recognition index (left panel). *p < 0.05, compared with WT. Investigation time (right panel). *p < 0.05, compared with training. (C) LTM formed by training for 3 min (WT, n = 28; OFF/ON, n = 26; OFF, n = 17). Recognition index (left panel). *p < 0.05, compared with the other groups. Investigation time (right panel). *p < 0.05, compared with training. (D) LTM formed by massed or spaced training (0 min: WT, n = 11; H06, n = 13; 10 min: WT, n = 12; H06, n = 11; 1 h: WT, n = 17; H06, n = 11). Recognition index (left panel). *p < 0.05, compared with the other groups. Investigation time (right panel). *p < 0.05, compared with the first exposure during training. (E) LTM formed by training for 3 min in WT (n = 11) and dnRAR H02 (n = 13) mice. Recognition index (left panel). *p < 0.05. Investigation time (right panel). *p < 0.05, compared with training. Error bars indicate SEM.
Figure 4
Figure 4
Impaired spatial memory in dnRAR mice and its rescue by spaced training. (A) Escape latencies during training with a 1 min interval (left panel; WT, n = 18; H06, n = 12). Data are indicated in blocks of 2 trials. Probe test at day 8 (right panel). *p < 0.05 compared with the other 3 quadrants. (B) Escape latencies during training with a 1 h interval (left panel; WT, n = 15; H06, n = 12). Data are indicated in blocks of 2 trials. Probe test at day 8 (right panel). *p < 0.05 compared with the other 3 quadrants. Error bars indicate SEM.
Figure 5
Figure 5
Impaired social recognition memory by the pharmacological inhibition of hippocampal RARα. Recognition index (left panel). Effects of micro-infused Ro41-5253 (Ro41; 242 pg/side) into the dorsal hippocampus at 1, 4, or 24 h before training and the effects of micro-infused low-dose Ro41 (24 pg/side) on 24 h LT-social recognition memory (VEH, n = 38; 1 h, n = 12; 4 h-low, n = 11; 4 h, n = 13; 24 h, n = 12). *p < 0.05, compared with the VEH group. Investigation time (right panel). *p < 0.05, compared with training. The lower panel indicates cannula tip placement in mice infused with VEH or Ro41.

References

    1. Mangelsdorf DJ. Vitamin A receptors. Nutr Rev. 1994;52:S32–44. - PubMed
    1. Sucov HM, Evans RM. Retinoic acid and retinoic acid receptors in development. Mol Neurobiol. 1995;10:169–184. doi: 10.1007/BF02740674. - DOI - PubMed
    1. Napoli JL. Retinoic acid biosynthesis and metabolism. FASEB J. 1996;10:993–1001. - PubMed
    1. Chambon P. A decade of molecular biology of retinoic acid receptors. FASEB J. 1996;10:940–954. - PubMed
    1. Evans RM. The steroid and thyroid hormone receptor superfamily. Science. 1988;240:889–895. doi: 10.1126/science.3283939. - DOI - PMC - PubMed

Publication types

MeSH terms