Sources of regional variation in Medicare Part D drug spending
- PMID: 22316446
- PMCID: PMC3285245
- DOI: 10.1056/NEJMsa1104816
Sources of regional variation in Medicare Part D drug spending
Abstract
Background: Sources of regional variation in spending for prescription drugs under Medicare Part D are poorly understood, and such variation may reflect differences in health status, use of effective treatments, or selection of branded drugs over lower-cost generics.
Methods: We analyzed 2008 Medicare data for 4.7 million beneficiaries for prescription-drug use and expenditures overall and in three drug categories: angiotensin-converting-enzyme (ACE) inhibitors and angiotensin-receptor blockers (ARBs), 3-hydroxy-3-methylglutaryl coenzyme A (HMG-CoA) reductase inhibitors (statins), and selective serotonin-reuptake inhibitors (SSRIs) and serotonin-norepinephrine reuptake inhibitors (SNRIs). Differences in per capita expenditures across hospital-referral regions (HRRs) were decomposed into annual prescription volume and cost per prescription. The ratio of prescriptions filled as branded drugs to all prescriptions filled was calculated. We adjusted all measures for demographic, socioeconomic, and health-status differences.
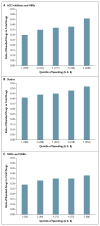
Results: Mean adjusted per capita pharmaceutical spending ranged from $2,413 in the lowest to $3,008 in the highest quintile of HRRs. Most (75.9%) of that difference was attributable to the cost per prescription ($53 vs. $63). Regional differences in cost per prescription explained 87.5% of expenditure variation for ACE inhibitors and ARBs and 56.3% for statins but only 36.1% for SSRIs and SNRIs. The ratio of branded-drug to total prescriptions, which correlated highly with cost per prescription, ranged across HRRs from 0.24 to 0.45 overall and from 0.24 to 0.55 for ACE inhibitors and ARBs, 0.29 to 0.60 for statins, and 0.15 to 0.51 for SSRIs and SNRIs.
Conclusions: Regional variation in Medicare Part D spending results largely from differences in the cost of drugs selected rather than prescription volume. A reduction in branded-drug use in some regions through modification of Part D plan benefits might lower costs without reducing quality of care. (Funded by the National Institute on Aging and others.).
Figures

Comment in
-
Regional variation in Medicare Part D drug spending.N Engl J Med. 2012 May 10;366(19):1842; author reply 1842-3. doi: 10.1056/NEJMc1202765. N Engl J Med. 2012. PMID: 22571214 No abstract available.
-
Regional variation in Medicare Part D drug spending.N Engl J Med. 2012 May 10;366(19):1842; author reply 1842-3. doi: 10.1056/NEJMc1202765. N Engl J Med. 2012. PMID: 22571215 No abstract available.
References
-
- Sutherland JM, Fisher ES, Skinner JS. Getting past denial — the high cost of health care in the United States. N Engl J Med. 2009;361:1227–30. - PubMed
-
- Fisher ES, Wennberg DE, Stukel TA, Gottlieb DJ, Lucas FL, Pinder EL. The implications of regional variations in Medicare spending. Part 1: the content, quality, and accessibility of care. Ann Intern Med. 2003;138:273–87. - PubMed
-
- The implications of regional variations in Medicare spending. Part 2: health outcomes and satisfaction with care. Ann Intern Med. 2003;138:288–98. Idem. - PubMed
Publication types
MeSH terms
Substances
Grants and funding
- R01 AG034056/AG/NIA NIH HHS/United States
- UL1 TR000005/TR/NCATS NIH HHS/United States
- AG-07-001/AG/NIA NIH HHS/United States
- UL1 RR024153/RR/NCRR NIH HHS/United States
- K23 AG028947/AG/NIA NIH HHS/United States
- R01 NR010135/NR/NINR NIH HHS/United States
- R01 HS018721/HS/AHRQ HHS/United States
- P01AG019783/AG/NIA NIH HHS/United States
- CDA 09-207/HX/HSRD VA/United States
- R34 MH082682/MH/NIMH NIH HHS/United States
- R01 HS017695/HS/AHRQ HHS/United States
- K23AG028947/AG/NIA NIH HHS/United States
- R01AG034056/AG/NIA NIH HHS/United States
- K07AG033174/AG/NIA NIH HHS/United States
- K07 AG033174/AG/NIA NIH HHS/United States
- P30 AG024827/AG/NIA NIH HHS/United States
- R56 AG027017/AG/NIA NIH HHS/United States
- P30AG024827/AG/NIA NIH HHS/United States
- P01 AG019783/AG/NIA NIH HHS/United States
- K23 AG035030/AG/NIA NIH HHS/United States
- K12 HS019461/HS/AHRQ HHS/United States
- U01 AG012553/AG/NIA NIH HHS/United States
- KL2 TR000146/TR/NCATS NIH HHS/United States
- T32 AG021885/AG/NIA NIH HHS/United States
LinkOut - more resources
Full Text Sources
Medical
Miscellaneous
