. 2012 Apr;64(4):807-19.
doi: 10.1016/j.marpolbul.2012.01.013. Epub 2012 Feb 7.

Indicators of sediment and biotic mercury contamination in a southern New England estuary

Affiliations

Indicators of sediment and biotic mercury contamination in a southern New England estuary

David L Taylor et al. Mar Pollut Bull. 2012 Apr.

Abstract

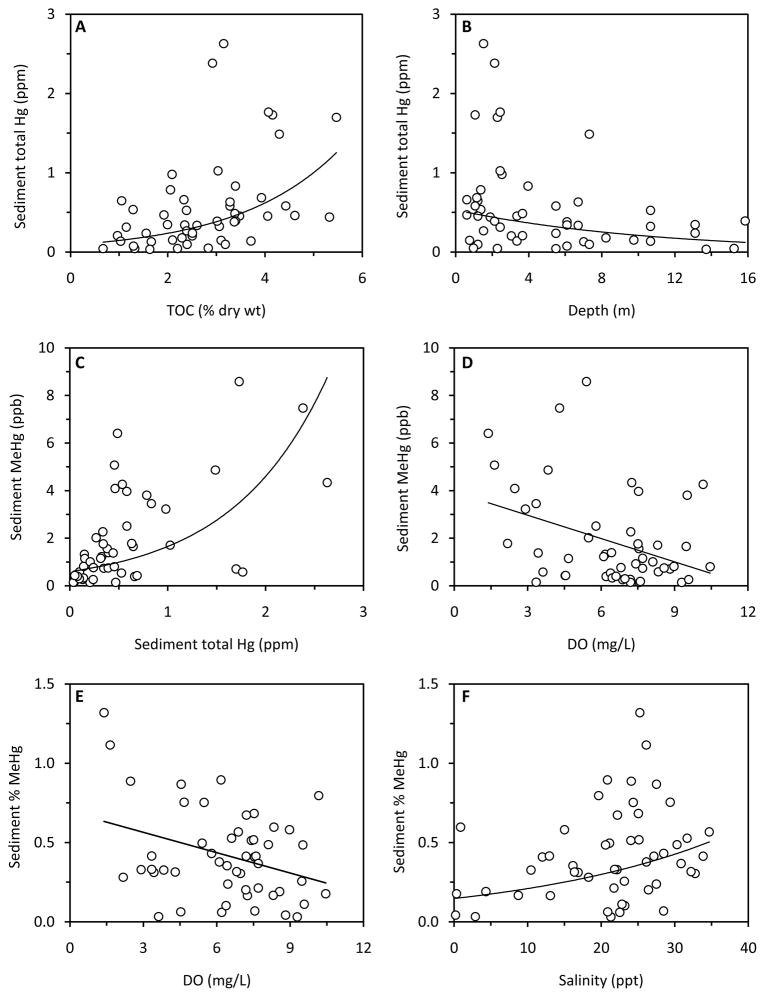
Total mercury (Hg) and methylmercury (MeHg) were analyzed in near surface sediments (0-2 cm) and biota (zooplankton, macro-invertebrates, finfish) collected from Narragansett Bay (Rhode Island/Massachusetts, USA) and adjacent embayments and tidal rivers. Spatial patterns in sediment contamination were governed by the high affinity of Hg for total organic carbon (TOC). Sediment MeHg and percent MeHg were also inversely related to summer bottom water dissolved oxygen (DO) concentrations, presumably due to the increased activity of methylating bacteria. For biota, Hg accumulation was influenced by inter-specific habitat preferences and trophic structure, and sediments with high TOC and percent silt-clay composition limited mercury bioavailability. Moreover, hypoxic bottom water limited Hg bioaccumulation, which is possibly mediated by a reduction in biotic foraging, and thus, dietary uptake of mercury. Finally, most biota demonstrated a significant positive relationship between tissue and TOC-normalized sediment Hg, but relationships were much weaker or absent for sediment MeHg. These results have important implications for the utility of estuarine biota as subjects for mercury monitoring programs.


Figures

Fig. 1
Fig. 1
Map of the Narragansett Bay (Rhode Island/Massachusetts, USA) and adjacent embayments and tidal rivers with points denoting sediment and biota collections sites.
Fig. 2
Fig. 2
Spatial distribution of total mercury (Hg; ppm dry wt) (A), methylmercury (MeHg; ppb dry wt) (B), and percent methylmercury (% MeHg = MeHg/total Hg) (C) in near surface sediments (0–2 cm) collected from the Narragansett Bay (n = 51).
Fig. 3
Fig. 3
Surface sediment total mercury (Hg; ppm dry wt) (A, B), methylmercury (MeHg; ppb dry wt) (C, D), and percent methylmercury (% MeHg = MeHg/total Hg) (E, F) as a function of site-specific geochemical conditions, including total organic carbon (TOC, % dry wt), water depth (m), dissolved oxygen (DO, mg/L), and salinity (ppt). Least-squares exponential or linear regression models were fit to data (n = 51).
Fig. 4
Fig. 4
Biotic total mercury concentrations (Hg; ppm dry wt) (A) stable nitrogen (δ15N) and carbon (δ13C) isotope signatures (B, C), and biota-sediment accumulation factors (BSAF(Hg) and BSAF(MeHg)= biota total Hg/sediment Hg or MeHg, respectively) (D). Biota include killifish (Killi), polychaetes (Poly), gastropods (Gastro), shrimp, crabs, bivalve, amphipods-isopods (Amp-Iso), and zooplankton (Zoopl). Different lowercase letters denote significant differences in mean values, whereas the same lowercase letters indicate non-significant differences (Ryan’s Q multiple comparison test). Also, for panel C, interspecies δ13C signatures were used to assess whether biota derived carbon from pelagic or benthic sources (Peterson and Fry, 1987). All values represent means ± 1 standard error.
Fig.5
Fig.5
Relationship between total mercury concentration (Hg; ppm dry wt) and stable nitrogen (δ15N) signatures of biota (means ± 1 standard error). A least-squares linear regression model was fit to the full data set, and the equation and R2-value are presented.
Fig. 6
Fig. 6
Biota-sediment accumulation factors (BSAF(Hg) and BSAF(MeHg) = biota total Hg/sediment Hg or MeHg) as a function of site-specific geochemical conditions, including total organic carbon (TOC, % dry wt) (A), grain size (% silt-clay) (B), and bottom water dissolved oxygen (DO, mg/L) (C, D). Least-squares exponential regression models were fit to data (n = 218).
Fig. 7
Fig. 7
Biotic total mercury concentrations (Hg; ppm dry wt) as a function of sediment total Hg (Hg; ppm dry wt) normalized by total organic carbon (% dry wt). Biota include zooplankton (A; n = 37), polychaetes (B; n = 15), gastropods (C; n = 14), bivalves (D; n = 33), amphipods-isopods (E; n = 8), shrimp (F; n = 40), crabs (G; n = 35), and killifish (H; n = 36). All data points represent the mean total Hg of individuals collected from a single site (average ~ 10 individuals per site; range = 2 to 49 individuals per site). Least-squares linear regression models were fit to the data.

References

    1. Anderson JR, Hardy EE, Roach JT, Witmer RE. US Geological Survey Professional Paper. 964. USGS; Washington, D.C: 1976. A land use and land cover classification system for use with remote sensor data.
    1. Balcom PH, Fitzgerald WF, Vandal GM, Lamborg CH, Rolfhus KR, Langer CS, et al. Mercury sources and cycling in the Connecticut River and Long Island Sound. Mar Chem. 2004;90:53–74.
    1. Benoit JM, Gilmour CC, Heyes A, Mason RP, Miller CL. Biogeochemistry of Environmentally Important Trace Elements. ACS Symposium Series 835. American Chemical Society; Washington, DC: 2003. Geochemical and biological controls over methylmercury production and degradation in aquatic ecosystems; pp. 262–297.
    1. Benoit JM, Gilmour CC, Mason RP, Heyes A. Sulfide controls on mercury speciation and bioavailability to methylating bacteria in sediment pore waters. Environ Sci Technol. 1999;33:951–957.
    1. Benoit JM, Gilmour CC, Mason RP, Riedel GS, Riedel GF. Behavior of mercury in the Patuxent River estuary. Biogeochem. 1998;40:249–265.

Publication types