. 2012 Apr;86(8):4245-52.
doi: 10.1128/JVI.07114-11. Epub 2012 Feb 8.

Plasmacytoid dendritic cells reduce HIV production in elite controllers

Affiliations

Plasmacytoid dendritic cells reduce HIV production in elite controllers

K Machmach et al. J Virol. 2012 Apr.

Abstract

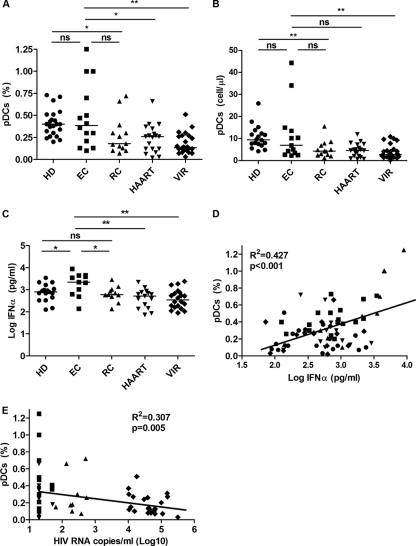
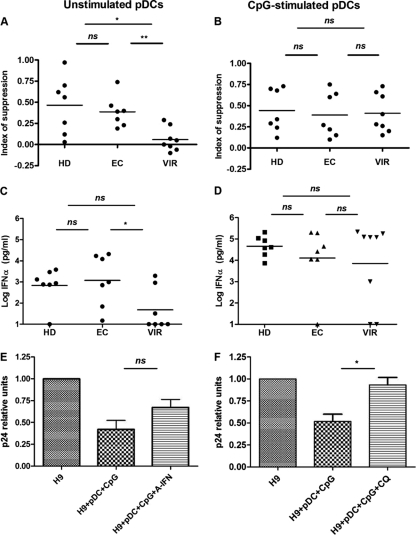
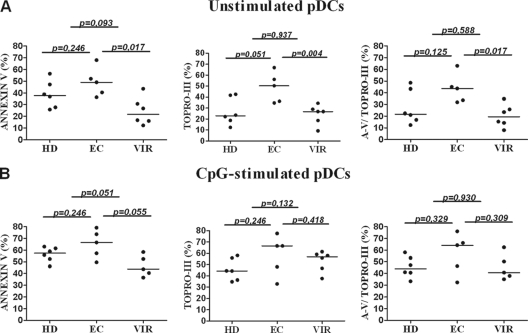
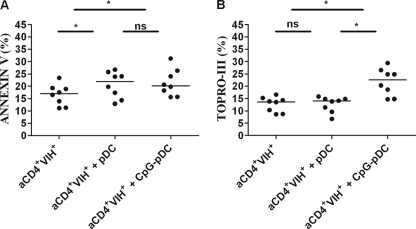
HIV elite controllers (EC) are a rare group of HIV-infected patients who are able to maintain undetectable viral loads during a long period of time in the absence of antiretroviral treatment. Adaptive immunity and host genetic factors, although implicated, do not entirely explain this phenomenon. On the other hand, plasmacytoid dendritic cells (pDCs) are the principal type I interferon (IFN) producers in response to viral infection, and it is unknown whether pDCs are involved in the control of HIV infection in EC. In our study, we analyzed peripheral pDC levels and IFN-α production by peripheral blood mononuclear cells (PBMCs) in EC compared to other groups of HIV-infected patients, the ability of pDCs to reduce HIV production in vitro, and the mechanisms potentially involved. We showed preserved pDC counts and IFN-α production in EC. We also observed a higher capacity of pDCs from EC to reduce HIV production and to induce T cell apoptosis, whereas pDCs from viremic patients barely responded without previous Toll-like receptor 9 (TLR-9) stimulus. The preserved functionality of pDCs from EC to reduce viral production may be one of the mechanisms involved in the control of HIV viremia in these subjects. These results demonstrate the importance of innate immunity in HIV pathogenesis, and an understanding of pDC mechanisms would be helpful for the design of new therapies.


Figures

Fig 1
Fig 1
Quantification of peripheral pDCs and IFN-α production. (A and B) pDC quantification. Percentages (A) and absolute numbers (B) of pDCs (BDCA2+ CD123+) from 22 healthy donors (HD), 14 elite controllers (EC), 13 relative controllers (RC), 19 HIV-treated patients (HAART), and 25 viremic subjects (VIR) were determined. (C) IFN-α production measured in the supernatants of PBMC cultures, in the presence of a TLR-9 ligand (CpG ODN 2216), from 18 HD, 11 EC, 11 RC, 15 HAART, and 22 VIR subjects. The level of IFN-α production by PBMCs cultured in medium alone was in all the cases below the detection limits (data not shown). (D) Correlation between numbers of peripheral pDCs and HIV RNA copies/ml (log10) in 11 EC, 11 RC, 15 HAART, and 22 VIR subjects. (E) Correlation between numbers of peripheral pDCs and IFN-α produced by CpG-stimulated PBMCs from 18 HD, 11 EC, 11 RC, 15 HAART, and 22 VIR subjects. P values were determined by using a Mann-Whitney U test. ns, not significant (a P value of <0.05 was considered statistically significant); *, P < 0.05; **, P < 0.005.
Fig 2
Fig 2
pDC-mediated suppression of HIV production in H9 T cells. Purified pDCs from 7 HD, 7 EC, and 8 VIR subjects were plated overnight at 5 × 10⁴ pDCs/well with or without CpG and cocultured in the presence of HIV-infected T cells. After 5 days of coculture, amounts of p24 and IFN-α in the supernatants were measured by an ELISA. (A and B) Effects of unstimulated (A) and CpG-stimulated (B) pDCs on HIV-infected T cell line virus production. The index of suppression by pDCs is expressed as the difference of log HIV p24 production between the culture containing T cells alone and the coculture of T cells and pDCs [index of suppression = log HIV p24 (T cells) − log HIV p24 (T cells + pDCs)]. (C and D) IFN-α production measured in the supernatants of the coculture. (E) Implication of IFN-α in pDC-mediated viral suppression. IFN-α produced by pDCs was partially neutralized by the addition of an anti-IFN-α antibody. Data are representative of 5 different experiments (pDCs from 3 HD and 2 EC subjects). (F) Blocking of endocytosis by the addition of CQ at 1 μM to wells of CpG-stimulated pDCs. Data are representative of 7 different experiments (pDCs from 2 HD, 1 EC, and 4 VIR subjects). P values were determined by using a Mann-Whitney U test. ns, not significant (a P value of <0.05 was considered statistically significant); *, P < 0.05; **, P < 0.005.
Fig 3
Fig 3
pDC-mediated H9 T cell apoptosis. Unstimulated (A) and CpG-stimulated (B) pDC-induced apoptosis was assessed on H9 T cells from the cocultures of the suppression assays. The data represent data from 6 HD, 5 EC, and 6 VIR subjects. Left panels represent annexin V (A-V)-positive T cells, middle panels represent Topro-III-positive T cells, and right panels represent annexin V-positive/Topro-III-positive T cells. P values were determined by using a Mann-Whitney U test. A P value of <0.05 was considered statistically significant.
Fig 4
Fig 4
pDC-mediated HIV-infected primary autologous CD4+ T cell apoptosis. Isolated primary autologous CD4+ T cells from 8 healthy donors were infected for 6 days with HIV BaL. HIV-infected primary autologous CD4+ T cells (aCD4+ HIV+) were cultured in the presence of purified pDCs at a ratio of 1:2. After 24 h, annexin V-positive CD4+ T cells (A) and Topro-III-positive CD4+ T cells (B) were assayed by flow cytometry. Differences were analyzed by using a Wilcoxon test. A P value of <0.05 was considered statistically significant. ns, not statistically significant; *, P < 0.05.
Fig 5
Fig 5
Microscopy analysis of CD4 distribution in pDCs. Shown is three-dimensional microscopy of the CD4 distribution in pDCs. pDCs from HD, EC, and VIR subjects and HIV-activated pDCs from HD (HD+HIV) subjects were stained with anti-CD4 antibody (pink), anti-TLR-7 antibody (green), and DAPI (blue). pDC stainings (green, pink, and blue) were merged and analyzed by 3D microscopy.

References

    1. Chehimi J, et al. 2010. Inability of plasmacytoid dendritic cells to directly lyse HIV-infected autologous CD4+ T cells despite induction of tumor necrosis factor-related apoptosis-inducing ligand. J. Virol. 84:2762–2773 - PMC - PubMed
    1. Deeks SG, Walker BD. 2007. Human immunodeficiency virus controllers: mechanisms of durable virus control in the absence of antiretroviral therapy. Immunity 27:406–416 - PubMed
    1. Finke JS, Shodell M, Shah K, Siegal FP, Steinman RM. 2004. Dendritic cell numbers in the blood of HIV-1 infected patients before and after changes in antiretroviral therapy. J. Clin. Immunol. 24:647–652 - PubMed
    1. Gurney KB, Colantonio AD, Blom B, Spits H, Uittenbogaart CH. 2004. Endogenous IFN-alpha production by plasmacytoid dendritic cells exerts an antiviral effect on thymic HIV-1 infection. J. Immunol. 173:7269–7276 - PubMed
    1. Hardy AW, Graham DR, Shearer GM, Herbeuval JP. 2007. HIV turns plasmacytoid dendritic cells (pDC) into TRAIL-expressing killer pDC and down-regulates HIV coreceptors by Toll-like receptor 7-induced IFN-alpha. Proc. Natl. Acad. Sci. U. S. A. 104:17453–17458 - PMC - PubMed

Publication types