Comparative Study
. 2012 Jun;11(6):M111.015974.
doi: 10.1074/mcp.M111.015974. Epub 2012 Feb 7.

msCompare: a framework for quantitative analysis of label-free LC-MS data for comparative candidate biomarker studies

Affiliations
Comparative Study

msCompare: a framework for quantitative analysis of label-free LC-MS data for comparative candidate biomarker studies

Berend Hoekman et al. Mol Cell Proteomics. 2012 Jun.

Abstract

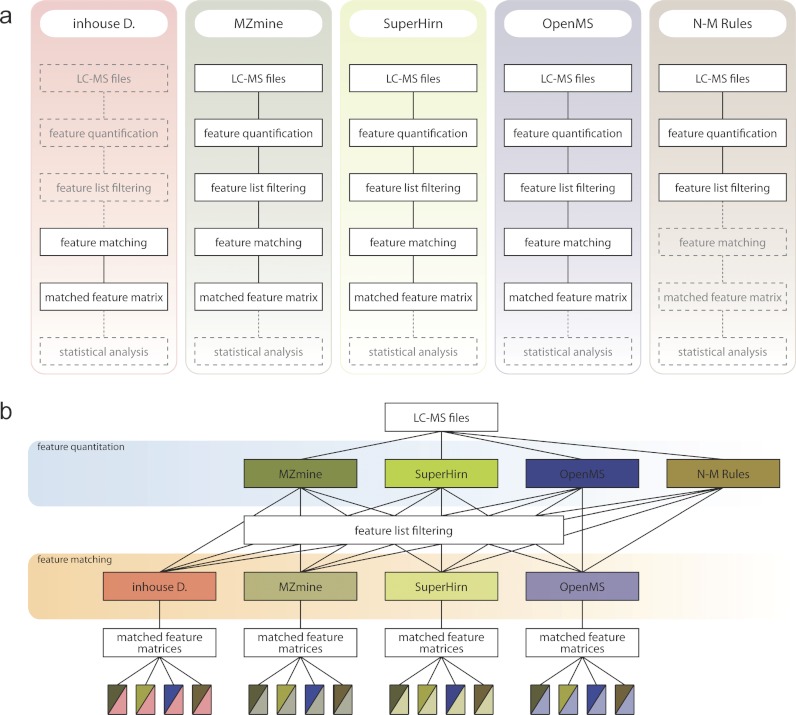
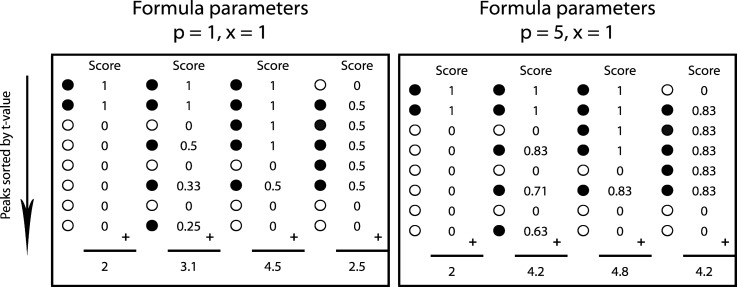
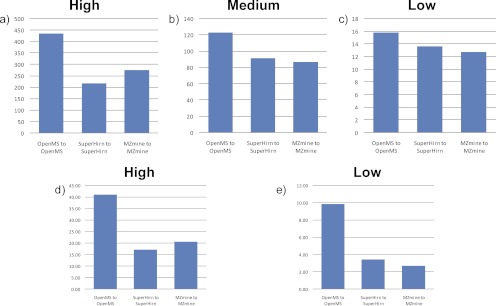
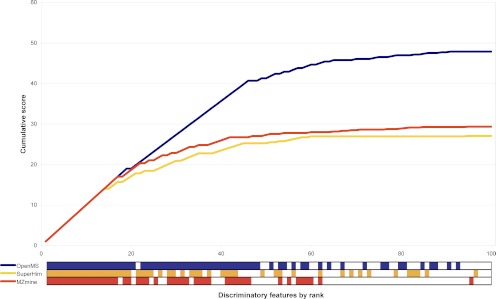
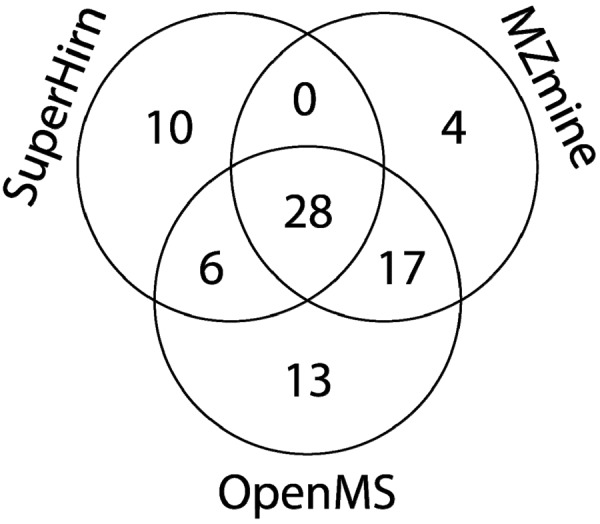
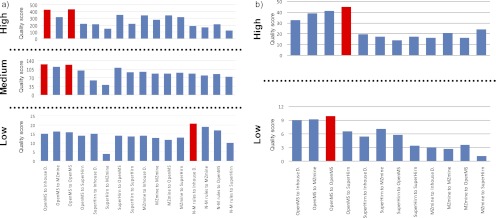
Data processing forms an integral part of biomarker discovery and contributes significantly to the ultimate result. To compare and evaluate various publicly available open source label-free data processing workflows, we developed msCompare, a modular framework that allows the arbitrary combination of different feature detection/quantification and alignment/matching algorithms in conjunction with a novel scoring method to evaluate their overall performance. We used msCompare to assess the performance of workflows built from modules of publicly available data processing packages such as SuperHirn, OpenMS, and MZmine and our in-house developed modules on peptide-spiked urine and trypsin-digested cerebrospinal fluid (CSF) samples. We found that the quality of results varied greatly among workflows, and interestingly, heterogeneous combinations of algorithms often performed better than the homogenous workflows. Our scoring method showed that the union of feature matrices of different workflows outperformed the original homogenous workflows in some cases. msCompare is open source software (https://trac.nbic.nl/mscompare), and we provide a web-based data processing service for our framework by integration into the Galaxy server of the Netherlands Bioinformatics Center (http://galaxy.nbic.nl/galaxy) to allow scientists to determine which combination of modules provides the most accurate processing for their particular LC-MS data sets.


Figures

Fig. 1.
Fig. 1.
msCompare computational framework combining modules from different open source data processing workflows. a, overview of different open source data processing workflows modularized in msCompare. b, overview of the computational framework, which allows execution of any combination of feature detection/quantification or feature alignment/matching modules of the original pipelines.
Fig. 2.
Fig. 2.
Examples showing the operational mechanism of the scoring function on four different quantitative matched feature matrices per parameter choice. Black dots (●) represent spike-related features, whereas white dots (○) represent other features (NSF in Equation 1). Equation 1 contains two constants, p and x, which influence the final scores. When p and x have stringent settings (left panel), the presence of NSFs in high rank positions of the matched feature matrix leads to a rapid decrease of the score for subsequent spike-related features. The value of x defines the degree to which non-spike-related features affect the score increase for less discriminatory spike-related features and has weaker influence on the score than p (see scores values for various x and p in supplemental Fig. S6 in the supplementary material). Setting these parameters more leniently (right panel) allows for more NSFs with lower discriminatory ranks without penalizing subsequent standard features severely. For evaluation of different workflows, we used p = 5 and x = 1. To remove the dependence of the total number of detected features n from the score, we corrected the score using a decoy approach. The decoy approach includes subtraction of the score obtained for randomly reshuffled matched feature matrix/matrices from the score obtained with the real matched feature matrix/matrices sorted according to the t value.
Fig. 3.
Fig. 3.
Comparison of the performance of the published, open source data processing workflows SuperHirn, OpenMS, and MZmine with LC-MS data derived from the analysis of human urine (a–c) and porcine CSF (d and e) samples spiked with a range of peptides. The scores were calculated with Equation 1. All of the workflows were compared with respect to high (a and d), medium (b), and low (c and e) concentration differences of the spiked peptides (see supplemental Tables S2 and S4). The OpenMS workflow outperforms the other two workflows at large (a) and medium (b) spiked concentration differences, whereas performances are approaching each other at the lowest (c) spiked concentration difference in human urine data sets. In porcine CSF, OpenMS performed best at both high and low spiked concentration differences.
Fig. 4.
Fig. 4.
Overview of the score evaluation function for the most discriminating features for three homogenous workflows (see Fig. 3) when comparing the 16-fold pLLOQ spiked samples with the blank (0.1-fold pLLOQ) obtained with the human urine data set. The bars at the bottom of the graph provide visual indication of the ranks at which features related to the spiked peptides were found for the respective workflow (blue, OpenMS; orange, SuperHirn; red, MZmine). Non-spike-related features are represented in this subplot as white squares. The OpenMS workflow found only one non-spiked-related feature up to rank 48, whereas the other two workflows showed a less consistent performance, leading to lower scores.
Fig. 5.
Fig. 5.
Venn diagram of spike-related features found among the 100 most discriminatory features by the three homogenous workflows (see Fig. 3) obtained with the spiked human urine data set. The data were obtained by comparing the 16-fold pLLOQ spike level with the blank (0.1-fold pLLOQ). OpenMS found 64 (82% of the total number of unique features found by all workflows) of all unique features related to the spiked peptides. It also identified the highest number (13) of unique features related to the spiked compounds not identified by any of the other workflows.
Fig. 6.
Fig. 6.
Comparison of the performance of 16 and 12 different combinations of feature detection/quantification and feature alignment/matching modules at high, medium, and low concentration differences of spiked peptides (see supplemental Tables S6 and S7) using the spiked human urine data set (a) and the spiked porcine CSF data set (b), respectively. Labels of the hybrid workflows (x axis) start with the name of the feature detection/quantification module followed by the name of the feature alignment/matching module. The best performing workflows at each concentration level difference are highlighted in red. The homogeneous OpenMS workflow and combinations of the OpenMS feature detection/quantification module with the in-house developed feature alignment/matching module result in the highest scores when concentration differences are large or medium for the spiked human urine data set (a), whereas the respective combination of the OpenMS-SuperHirn heterogeneous workflow provides the best performance for the porcine CSF data set spiked with large concentration differences (b). The scores level out at medium concentration differences, although some combinations do not perform well at any level (e.g. SuperHirn to MZmine). The combination N-M rules feature detection/matching module with the in-house developed feature alignment/matching module (Inhouse D.) performs best for low spiked concentration differences for spiked human urine data set (M-N rule peak picking was not performed for porcine CSF data set because of the incompatibility of this approach with high resolution data), whereas the best performing combination of feature detection/quantification and feature alignment/matching modules for the low spiked concentration difference of the porcine spiked CSF data set is the respective OpenMS homogenous workflow.

References

    1. Chen G., Pramanik B. N. (2009) Application of LC/MS to proteomics studies: Current status and future prospects. Drug Discov. Today 14, 465–471 - PubMed
    1. Nilsson T., Mann M., Aebersold R., Yates J. R., 3rd, Bairoch A., Bergeron J. J. (2010) Mass spectrometry in high-throughput proteomics: Ready for the big time. Nat. Methods 7, 681–685 - PubMed
    1. Domon B., Aebersold R. (2010) Options and considerations when selecting a quantitative proteomics strategy. Nat. Biotechnol. 28, 710–721 - PubMed
    1. Allwood J. W., Goodacre R. (2010) An introduction to liquid chromatography-mass spectrometry instrumentation applied in plant metabolomic analyses. Phytochem. Anal. 21, 33–47 - PubMed
    1. Griffiths W. J., Wang Y. (2009) Mass spectrometry: From proteomics to metabolomics and lipidomics. Chem. Soc. Rev. 38, 1882–1896 - PubMed

Publication types

LinkOut - more resources