
The Drosophila melanogaster Genetic Reference Panel

Trudy F C Mackay et al. Nature. .

Abstract

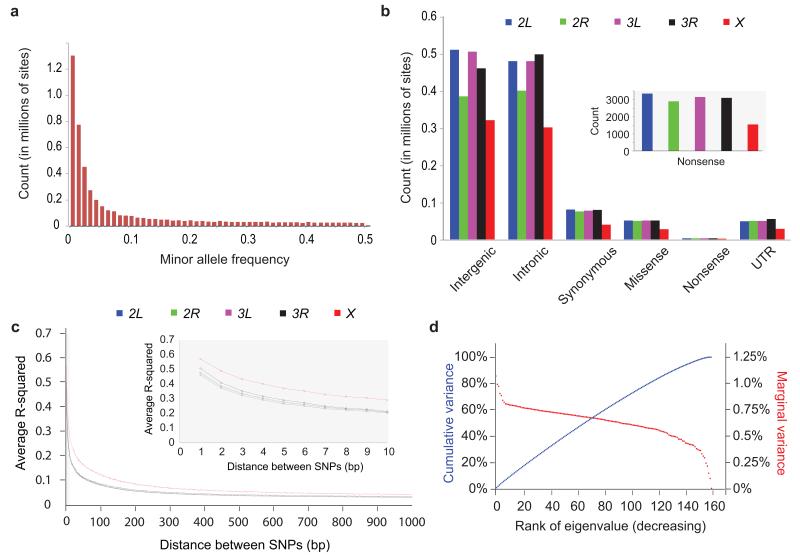
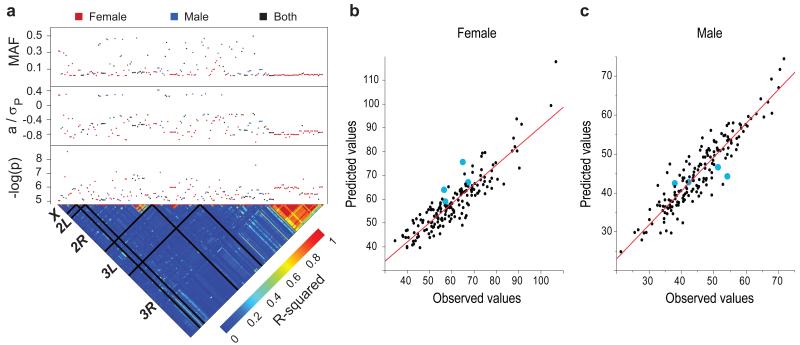
A major challenge of biology is understanding the relationship between molecular genetic variation and variation in quantitative traits, including fitness. This relationship determines our ability to predict phenotypes from genotypes and to understand how evolutionary forces shape variation within and between species. Previous efforts to dissect the genotype-phenotype map were based on incomplete genotypic information. Here, we describe the Drosophila melanogaster Genetic Reference Panel (DGRP), a community resource for analysis of population genomics and quantitative traits. The DGRP consists of fully sequenced inbred lines derived from a natural population. Population genomic analyses reveal reduced polymorphism in centromeric autosomal regions and the X chromosome, evidence for positive and negative selection, and rapid evolution of the X chromosome. Many variants in novel genes, most at low frequency, are associated with quantitative traits and explain a large fraction of the phenotypic variance. The DGRP facilitates genotype-phenotype mapping using the power of Drosophila genetics.


Figures

Fig. 1
Fig. 1
SNP variation in the DGRP lines. (a) Site frequency spectrum. (b) Numbers of SNPs per site class. (c) Decay of LD (r2) with physical distance for the five major chromosome arms. (d) Lack of population structure. The red curve depicts the ranked eigenvalues of the genetic covariance matrix in decreasing order with respect to the marginal variance explained; the blue curve shows their cumulative sum as a fraction of the total with respect to cumulative variance explained. The partitioning of total genetic variance is balanced among the eigenvectors. The principal eigenvector explains <1.1% of the total genetic variance.
Fig. 2
Fig. 2
Pattern of polymorphism, divergence, α and recombination rate along chromosome arms in non-overlapping 50 kbp windows. (a) Nucleotide polymorphism (π). The solid curves give the recombination rate (cM/Mb). (b) Divergence (k) for D. simulans (light green) and D. yakuba (dark green). (c) Polymorphism/Divergence, estimated as 1- [(π0-fold/π4-fold)/(k0-fold/k4-fold)]. An excess of 0-fold divergence relative to polymorphism (k0-fold/k4-fold) > (π0-fold/π4-fold) is interpreted as adaptive fixation while an excess of 0-fold polymorphism relative to divergence (π0-fold/π4-fold) > (k0-fold/k4-fold) indicates weakly deleterious or nearly neutral mutations are segregating in the population. Tel: telomere; Cent: centromere.
Fig. 3
Fig. 3
The fraction of alleles segregating under different selection regimes by site class and chromosome region, for the autosomes (A) and the X chromosome (X). The selection regimes are strongly deleterious (d, dark blue), weakly deleterious (b, blue), recently neutral (γ, white) and old neutral (f-γ, light blue) Each chromosome arm has been divided in three regions of equal size (in Mb): centromere, middle and telomere.
Fig. 4
Fig. 4
Genotype-phenotype associations for starvation resistance. (a) GWA results for significant SNPs. The lower triangle depicts LD (r2) among SNPs, with the five major chromosome arms demarcated by black lines. The upper panels give the significance threshold (-log10p, uncorrected for multiple tests), the effect in phenotypic standard deviation units, and the minor allele frequency (MAF). (b-c) Partial Least Squares regressions of phenotypes predicted using SNP data on observed phenotypes. The blue dots represent the predicted and observed phenotypes of lines that were not included in the initial study. (b) Females (r2 = 0.81). (c) Males (r2 = 0.85).

References

    1. Falconer DS, Mackay TFC. Introduction to Quantitative Genetics. Addison Wesley Longman; Harlow: 1996.
    1. Lynch M, Walsh B. Genetics and Analysis of Quantitative Traits. Sinauer Associates; Sunderland, Massachusetts: 1998.
    1. Flint J, Mackay TFC. Genetic architecture of quantitative traits in flies, mice and humans. Genome Res. 2009;19:723–733. - PMC - PubMed
    1. Mackay TFC, Stone EA, Ayroles JF. The genetics of quantitative traits: Challenges and prospects. Nat. Rev. Genet. 2009;10:565–577. - PubMed
    1. Altshuler D, Daly MJ, Lander ES. Genetic mapping in human disease. Science. 2008;322:881–888. - PMC - PubMed

Publication types